
Why Amateur Basketball Teams Need Analytics Now
Key Takeaways
Basketball analytics for amateur teams can raise team performance and sharpen individual skills.
Metrics like PER, TS%, and ORTG give coaches an objective basis for decisions.
Platforms like Scouting4U offer analytics solutions built for amateur teams.
Data-driven decisions help coaches avoid the biases that come with eye-test-only scouting.
You can start small with free tools and scale up as your program grows.
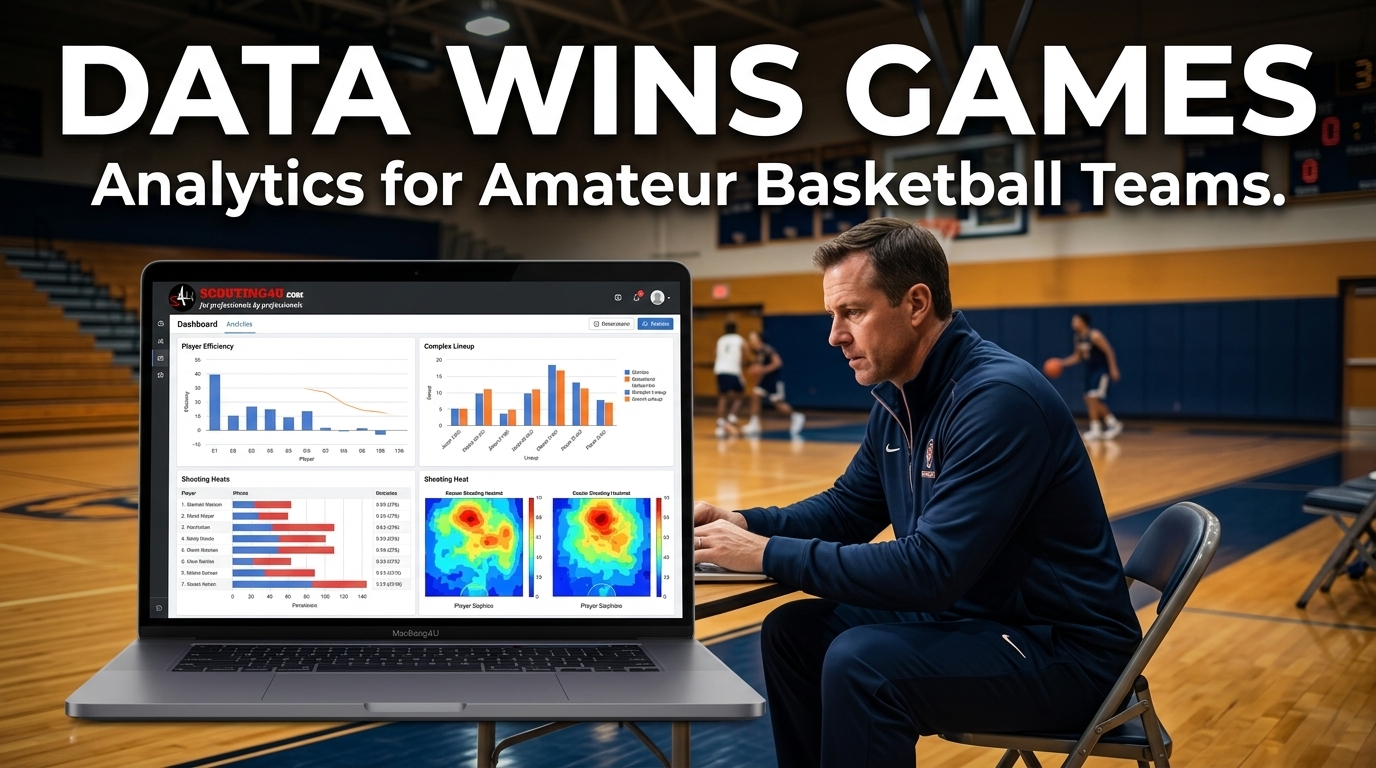
Basketball analytics for amateur teams is no longer something only NBA front offices can use. Today, any coach with a laptop and the right platform can track the same types of metrics that professional teams rely on. The gap between pro-level insight and amateur-level access has closed fast. If your team is still making lineup decisions based purely on gut feeling, you are leaving wins on the table. This article explains why basketball analytics for amateur teams matters right now, which metrics to focus on, and how to get started without a big budget. More and more recreational and semi-pro programs are adopting basketball analytics for amateur teams because the barrier to entry has dropped dramatically - and the competitive edge is real.
Why Basketball Analytics for Amateur Teams Has Changed the Game
Analytics in basketball started with box scores - points, rebounds, assists. Simple stuff. Over the past two decades, the sport moved toward advanced metrics that capture what box scores miss. Player Efficiency Rating (PER), True Shooting Percentage (TS%), Offensive Rating (ORTG), and Defensive Rating (DRTG) became standard in professional basketball by the mid-2000s.
What changed for amateur programs is access. A decade ago, running advanced stats required a dedicated analyst, expensive software, and hours of manual data entry. Now, platforms designed specifically for basketball analytics for amateur teams handle most of that work automatically. You upload game film, tag possessions, and the software produces metrics your coaching staff can act on immediately.
The result is that amateur coaches can now answer questions they never could before. Which defender allows the lowest field goal percentage when guarding pick-and-rolls? Which player's shooting efficiency drops in the fourth quarter? Which lineup combination produces the best net rating over 10 possessions? Basketball analytics for amateur teams puts those answers within reach.
If you want to understand the broader market shift behind this trend, the Basketball Analytics Market Growth Trends 2026 article breaks down where investment and innovation are heading over the next several years.
Core Metrics Every Amateur Coach Should Track
You do not need to track every statistic to get value from basketball analytics for amateur teams. Start with a focused set of metrics that connect directly to winning and losing. These numbers give you a foundation - and once your staff gets comfortable reading them, adding more becomes straightforward.
Player Efficiency Rating (PER) combines a player's positive contributions - scoring, rebounding, assists, blocks, steals - against their negative ones like turnovers and missed shots. A league-average PER in the NBA is 15. In your amateur league, you set the baseline yourself and track improvement over time.
True Shooting Percentage (TS%) tells you how efficiently a player scores when you account for two-pointers, three-pointers, and free throws together. A player who scores 20 points by shooting 8-for-25 from the field is hurting your offense more than helping it. TS% catches that problem where raw scoring totals do not. For a deeper look at the calculation, see this guide on True Shooting Percentage in Basketball.
Offensive Rating (ORTG) and Defensive Rating (DRTG) measure how many points your team scores or allows per 100 possessions. These are more useful than total points because they normalize for pace. A team that plays fast will score more points in a game simply because they take more shots. ORTG and DRTG strip that effect out.
Net Rating is just ORTG minus DRTG. It is the single best predictor of whether a team will win. Track it by lineup combination and you will quickly see which five-man units are helping you and which are hurting you.
Pick-and-Roll Defense Coverage Rate shows how often your defenders contain the ball-handler versus how often they give up an advantage. This one metric can reshape how you run your half-court defense in practice.
For a full breakdown of these and other advanced metrics, the Advanced Basketball Statistics: Must-Know Metrics guide is worth bookmarking.
Common Mistakes Coaches Make Before Adopting Basketball Analytics for Amateur Teams
Most amateur coaches are smart, experienced basketball people. But without data, even experienced coaches repeat the same mistakes.
The most common one is over-relying on the eye test. Watching games generates strong impressions, but human memory is selective. Coaches tend to remember the last few possessions of a game more than the first half. They remember the dramatic block and forget the five defensive breakdowns that led up to it. Data does not have memory bias.
A second mistake is playing favorites based on practice performance rather than game performance. Some players look sharp in walkthroughs but shrink in live action. Others look sloppy in practice but compete well when it counts. Basketball analytics for amateur teams helps you separate practice reputation from game reality. Once coaches see those discrepancies in black and white, roster decisions get a lot easier to justify - to staff and to players.
Third, many coaches make lineup decisions based on seniority or position rather than actual lineup effectiveness. Tracking net rating by lineup combination often reveals that your "second unit" outperforms your starters in certain matchups. That is information worth acting on.
A fourth issue worth naming: coaches often apply the same defensive scheme to every opponent without checking the numbers first. Basketball analytics for amateur teams lets you identify opponent tendencies before tip-off and adjust your scheme accordingly, rather than figuring things out mid-game.
How to Use Shot Charts to Improve Offense
Shot charts are one of the most accessible entry points into basketball analytics for amateur teams. They show where on the floor your players are shooting from and what percentage they make from each zone.
A well-read shot chart tells you several things at once. It shows you which players are taking low-value mid-range shots when they could be attacking the rim or stepping back to the three-point line. It shows you which zones in your half-court offense generate the most efficient looks. And it shows you where your opponents are vulnerable defensively - information you can use for game planning.
The mechanics of shot chart analysis are straightforward once you know what to look for. The article on Basketball Shot Chart Analysis walks through the process step by step, including how to read heat maps and zone efficiency percentages.
Shot charts are also an effective communication tool with players. When a guard can see that 40% of his shot attempts come from the low-efficiency mid-range zone, that conversation is much shorter than any chalk-talk explanation. The visual makes the point immediately. That is one of the underappreciated reasons basketball analytics for amateur teams changes player development - it speeds up the feedback loop.
Video Tagging: Connecting Film to Data
Statistics tell you what happened. Video shows you why. The real power of basketball analytics for amateur teams comes when you combine both.
Video tagging software lets you label possessions as they happen - or while reviewing film afterward. You tag a pick-and-roll, a transition opportunity, a defensive breakdown. Once tagged, the software can pull every instance of that event across a full season. You are no longer relying on memory or a partial highlight clip. You can watch all 47 pick-and-roll possessions your team defended last month and see exactly which coverages held up and which ones failed.
This process changes how coaches run film sessions. Instead of showing the team a general highlight and hoping it sticks, you can show a precise pattern with statistical context attached. Players understand the problem faster and remember the correction longer.
For a practical walkthrough of how video tagging works in a real coaching workflow, see the guide on Basketball Video Tagging for Efficient Game Film Analysis.
Tools Built for Basketball Analytics for Amateur Teams
Several platforms compete in this space, but they are not all built with amateur programs in mind. Some are designed for large professional or college departments with multiple full-time analysts. They are expensive, complex, and require significant onboarding time. Basketball analytics for amateur teams needs a different kind of tool - one that does not assume you have a data science team sitting next to your bench.
Scouting4U takes a different approach. The platform was built by Daniel Gutt, who spent decades working in European professional basketball including at the EuroLeague level. He understood what coaching staffs actually need on a day-to-day basis versus what analytics platforms often deliver. The result is a tool that is genuinely usable without a dedicated analyst on staff.
Scouting4U offers shot chart generation, video tagging, lineup analysis, and player development tracking. It is designed so that a head coach can operate it without needing a separate data science background. The interface prioritizes clarity over complexity, which matters when you are preparing for a game in 48 hours and need answers fast.
You can review the full feature set at the Scouting4U platform features page. If you want to understand the pricing structure and what is included at each tier, the Scouting4U pricing page has a clear breakdown of plans built for programs at different budget levels.
Starting Small: A Practical Path Into Basketball Analytics for Amateur Teams
Basketball analytics for amateur teams does not require a full system overhaul on day one. Start with one metric. Track TS% for every player on your roster for four weeks. See what it tells you. Adjust your shot selection philosophy based on what you find. Then add a second metric - net rating by lineup - and run that for another month.
This staged approach keeps your staff from getting overwhelmed. Analytics only helps if your coaches actually trust and use the data. That trust builds gradually. Start with wins that are easy to see - a player whose TS% improves after you move him to the mid-post, a lineup whose net rating jumps when you adjust the rotation. Small, concrete results create buy-in faster than any presentation about data science.
Free resources can support the early stages. Basic stat tracking in spreadsheets, YouTube tutorials on reading PER, and community basketball forums all offer starting points with zero cost. As your staff becomes more comfortable, transition to a purpose-built platform. The jump in time savings and analytical depth is significant.
One thing coaches often overlook: document what you learn as you go. When basketball analytics for amateur teams is new to your program, institutional memory matters. Write down which metrics moved your decision-making and which ones turned out to be noise. That record becomes a reference tool for your entire staff as the program develops.
Analytics in Scouting and Recruitment
Basketball analytics for amateur teams is not only useful for managing your current roster. It also changes how you scout and recruit new players.
Objective metrics reduce the subjectivity that makes scouting unreliable. Two coaches can watch the same player and come away with completely different impressions. Data gives them a shared language. If a recruit's TS% is 62% over 30 games in a competitive league, that is a concrete data point that does not depend on which game each coach happened to watch.
Scouting reports built around analytics are more actionable than narrative-only reports. They tell your coaching staff exactly what a player does well, where they struggle, and how their tendencies fit your system. That specificity helps you make better roster decisions and communicate expectations to recruits more clearly.
Basketball analytics for amateur teams also helps during tryouts. Instead of relying on one-day impressions, you can track a small set of metrics across multiple sessions and compare players on the same scale. That process reduces the influence of first impressions and gives quieter, less flashy players a fair shot at making the roster based on what they actually produce.
For a broader look at how this process works at different levels of the sport, the article on How Data Analytics Transforms Basketball Recruitment covers the full picture.
The Competitive Reality for Amateur Programs
Basketball analytics for amateur teams is not a future trend. It is already happening in competitive amateur and semi-professional leagues across Europe and North America. Coaches who have adopted data-driven methods are building more efficient offenses, reducing defensive breakdowns, and developing players faster.
Coaches who have not yet adopted these methods are not standing still - they are falling behind teams that have. The margin between winning and losing at the amateur level is often small. A few possession improvements per game, a better lineup rotation, a smarter shot selection philosophy - these add up over a season.
The tools exist. The data is available. Basketball analytics for amateur teams is no longer a question of whether your program can afford to use it. It is a question of whether you can afford not to. Programs that wait another year to get started are giving opponents a head start that is hard to close.
If you want to explore what a full analytics-driven coaching approach looks like in practice, the guide on Mastering Basketball Analytics for Coaches goes deep on implementation strategies that work at every level of the game.
Frequently Asked Questions
What are the best analytics tools for amateur basketball teams?
Scouting4U is one of the most practical options for programs getting started with basketball analytics for amateur teams. It was built with everyday coaching workflows in mind and does not require a dedicated analyst to operate. The platform covers shot charts, video tagging, lineup analysis, and player development tracking in one place. You can review the full feature list at the Scouting4U features page.
How can basketball analytics for amateur teams improve player development?
When you track individual metrics over time - TS%, PER, turnover rate, defensive rating on specific coverage types - you can see exactly where each player is improving and where they are stuck. That precision lets coaches tailor practice reps to actual weaknesses rather than general drills. Players also respond better when feedback is specific and backed by data they can see themselves.
Is it expensive to implement basketball analytics for amateur teams?
You can start for free. Basic spreadsheet tracking, free stat apps, and online tutorials cost nothing. As your program grows, platforms like Scouting4U offer tiered pricing that makes basketball analytics for amateur teams accessible without a professional team budget. Check the Scouting4U pricing page for current plan details.
How do I avoid common scouting mistakes when evaluating players?
Combine data with observation rather than using one or the other alone. Watch film to understand context - why a player made a decision, how they moved without the ball, how they responded under pressure. Use metrics to confirm or challenge what you saw. When your eyes and the data agree, you can recruit or develop with much more confidence. This is exactly where basketball analytics for amateur teams adds the most value - it gives your instincts a reality check.
Where should an amateur coach start with basketball analytics?
Pick one metric - True Shooting Percentage is a good first choice because it is easy to calculate and immediately actionable. Track it for your full roster over four weeks. Adjust your offensive philosophy based on what you find. Once your staff trusts that single data point, add net rating by lineup and build from there. Small steps taken consistently get you further than trying to build a full basketball analytics for amateur teams system overnight.
Enjoyed this article? Share it with others!
Founder & Lead Scout, Scouting4U
2x EuroLeague champion with 30+ years in professional basketball. Daniel won EuroLeague titles with Maccabi Tel Aviv, helped build the staff behind the 2007 European Championship, and has delivered 100+ professional scouting reports across 50+ leagues. If it happened in a European basketball front office, he was probably in the room. He founded Scouting4U in 2010 to bring championship-level scouting intelligence to every club.
No reviews yet. Be the first to share your experience!
Related Articles
Analyzing Basketball Player Potential: Scouting Insights
Key Takeaways Analyzing basketball player potential combines data analysis with scouting intuition. Core metrics includ...

Mastering Basketball Service: Scouting Insights & Tools
Key TakeawaysA strong basketball service covers everything from player evaluation to game strategy analysis.Scouting4U g...

One Shot Chart. Three Insights Visual: Game Plan Revolution
Key TakeawaysA basketball shot chart three insights visual approach reveals high-efficiency zones, player tendencies, an...