
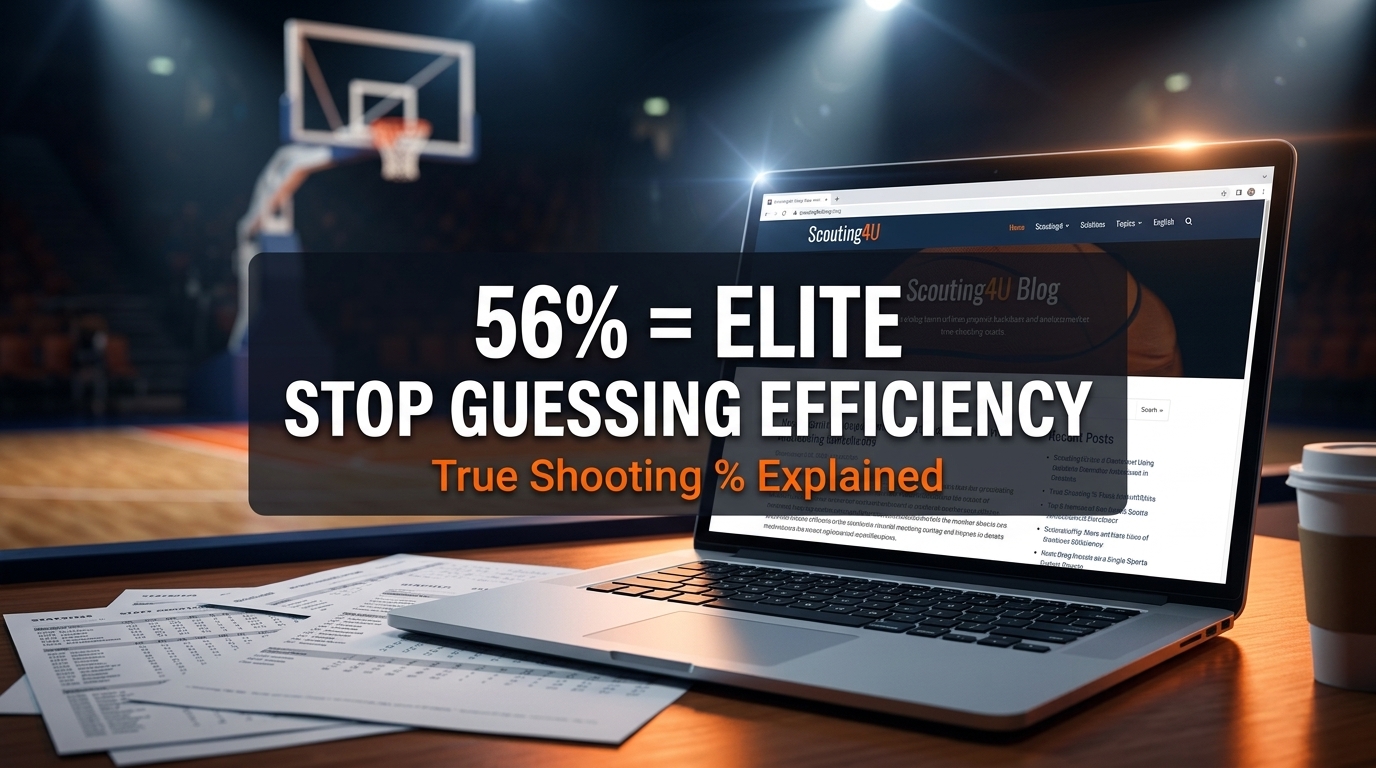
True Shooting Percentage Basketball: Calculation & Insights
Key Takeaways
True shooting percentage basketball offers a comprehensive efficiency metric that goes beyond simple field goal percentage.
TS% factors in all scoring attempts: field goals, free throws, and three-pointers.
Advanced basketball statistics like TS% give coaches and scouts a clearer picture of real scoring value.
Scouting4U integrates TS% to improve basketball analytics and recruitment decisions.
What Is True Shooting Percentage Basketball?
True shooting percentage basketball, abbreviated as TS%, measures how efficiently a player scores. It accounts for field goals, free throws, and three-point shots together. That makes it far more useful than traditional shooting percentages, which only track field goals made versus attempted.
For decades, coaches relied on field goal percentage as the main scoring metric. The problem? It treats a two-point jumper and a three-pointer as equivalent. A player who shoots 45% from the field but attempts mostly threes is generating more value per possession than those numbers suggest. True shooting percentage basketball solves that problem directly.
Scouts and analysts who work with advanced basketball statistics now treat TS% as a baseline metric for scoring efficiency. It comes up in almost every serious player evaluation, from college recruiting to professional roster decisions.
How to Calculate True Shooting Percentage Basketball
The formula looks like this:
TS% = Points Scored / (2 × (Field Goals Attempted + 0.44 × Free Throws Attempted))
The 0.44 constant is the part that trips people up. It exists because not every trip to the foul line produces two free throw attempts. Technical fouls result in one shot. And-one plays produce one attempt after the field goal. Three-point fouls yield three attempts. The 0.44 figure is a long-standing approximation that adjusts for this mix across a full season.
Here is a simple example. Say a player scores 500 points on 400 field goal attempts and 100 free throw attempts. The denominator is 2 × (400 + 0.44 × 100) = 2 × 444 = 888. So TS% = 500 / 888 = 0.563, or 56.3%.
That number tells you something field goal percentage cannot. It captures the full cost of each scoring opportunity and compares it against actual output. True shooting percentage basketball gives you efficiency in the truest sense of the word.
Want to go deeper on how these numbers interact with shot location? Check out basketball shot chart analysis - it pairs naturally with TS% to show where efficient scoring actually happens on the floor.
Interpreting True Shooting Percentage Basketball Benchmarks
Numbers without context are just noise. Here is how to read TS% in practice:
Below 50%: Below average. The player is losing value on most possessions.
50-55%: Average to slightly above average for most NBA seasons.
55-60%: Good. This range includes many solid starters and efficient role players.
Above 60%: Excellent. Elite scorers, efficient big men, and high-volume three-point shooters tend to land here.
Context still matters. A backup center who only dunks and shoots layups can post a 65% TS% without being particularly impressive. Meanwhile, a high-usage guard posting 58% while taking contested mid-range shots and drawing fouls is doing something genuinely difficult.
True shooting percentage basketball is most telling when you compare players with similar roles and usage rates. A star player scoring 28 points per game at 62% TS% is doing something rare. The same TS% from a player averaging 8 points per game is notable but less consequential to a team's offense.
League averages for TS% have shifted over time. The rise of the three-pointer pushed league-wide TS% upward through the 2010s. Understanding that historical baseline helps you interpret individual numbers accurately, especially when comparing players across different eras.
True Shooting Percentage Basketball vs. Other Efficiency Metrics
TS% does one thing well: it measures scoring efficiency. Other metrics do different things. Knowing the difference helps you use each one correctly.
Player Efficiency Rating (PER) gives you a broad summary of overall contribution - scoring, rebounding, assists, and defense rolled into one number. TS% does none of that. It only measures how efficiently a player turns attempts into points. The two metrics answer different questions, so they complement each other rather than compete. For a deeper look at PER, see our breakdown of basketball PER rating explained.
Effective field goal percentage (eFG%) is closely related to true shooting percentage basketball, but there is a meaningful difference. eFG% adjusts for the three-pointer but does not include free throws. TS% includes free throws. For players who draw contact and get to the line frequently, the gap between their eFG% and TS% can be significant. A player like James Harden at his peak could show a modest eFG% while posting a very high TS% because he generated so many free throw attempts.
Offensive rating (ORTG) works at the team or lineup level and measures points scored per 100 possessions. True shooting percentage basketball works at the individual shot attempt level. Both are worth tracking, but they answer different questions.
The takeaway: use TS% when you want to know how efficiently a specific player converts scoring opportunities. Use PER or ORTG when you want a broader view of contribution or team performance.
Why True Shooting Percentage Basketball Matters for Scouting
Scouting has changed significantly in the last decade. Data is now part of every serious evaluation, and true shooting percentage basketball sits near the top of the metrics that matter in recruitment and roster building.
When a scout evaluates a player in a European league, traditional stats can be misleading. Shot selection, pace of play, and defensive quality all vary between leagues. TS% cuts through some of that noise. A player posting 60% TS% in a competitive European league is demonstrating real scoring efficiency regardless of the system around them.
True shooting percentage basketball also helps identify undervalued players. A forward who averages 12 points per game might look ordinary. But if he is doing it at 64% TS% while sharing possessions with two other scorers, he may be one of the most efficient offensive players on the roster. Without TS%, that efficiency gets buried in the counting stats.
Scouts using platforms that integrate TS% alongside video and play-by-play data can make much faster and more accurate judgments. They can filter large player pools quickly, flagging anyone whose true shooting percentage basketball numbers clear a specific threshold, then dig into the film to understand how they are generating that efficiency.
The combination of TS% and shot chart data is especially powerful. A player might post high TS% because they only shoot at the rim and from three - a legitimate and repeatable skill. Another player might post similar numbers through an unusual volume of and-one plays that may not persist at a higher level. Context from the shot chart helps you understand which story is more likely to hold up.
How Scouting4U Uses True Shooting Percentage Basketball
Scouting4U integrates true shooting percentage basketball into player profiles and comparison tools across leagues. The platform lets coaches and scouts filter players by TS%, cross-reference those numbers with volume and shot location data, and pull up video clips to validate what the numbers suggest.
That workflow matters. TS% gives you a signal. The film confirms whether that signal is real. A player who posts 61% TS% because he exclusively catches and shoots open threes is valuable in the right system. A player posting the same number while creating his own shot off the dribble in traffic is valuable almost anywhere. Scouting4U helps you tell those stories apart quickly.
The platform also applies true shooting percentage basketball at the team level, letting coaches see how lineup combinations affect overall scoring efficiency. If one lineup consistently posts higher TS% than another with similar minutes, that is worth understanding before the next roster decision.
For anyone building out an analytics workflow, understanding true shooting percentage basketball is a logical starting point. It is straightforward to calculate, easy to interpret, and directly tied to the thing that wins games: scoring efficiently. From there, you layer in more context - shot charts, play-by-play data, defensive metrics - and the picture gets clearer.
Practical Tips for Coaches and Analysts
If you are integrating true shooting percentage basketball into your evaluation process for the first time, a few practical notes help.
First, establish your baseline. League averages for TS% differ between the NBA, EuroLeague, and college basketball. A 55% TS% in college might translate to roughly average at the pro level. Know what average looks like in the specific league you are evaluating before you draw conclusions.
Second, track TS% over time, not just for a single season. A player who has posted 58% or better for three consecutive seasons is demonstrating consistency. A single high-TS% season, especially on low volume, could be an outlier.
Third, use TS% as a filter, not a final verdict. It tells you who is worth a closer look. The film tells you whether the efficiency is real, sustainable, and a fit for your system. True shooting percentage basketball is a starting point in the evaluation process, not the end of it.
Finally, pair TS% with usage rate. High efficiency on low usage is easier to sustain than high efficiency on high usage. A player posting 62% TS% while handling 30% of his team's possessions is doing something genuinely difficult. That combination, high TS% plus high usage, is one of the clearest signals of elite offensive talent.
Conclusion
True shooting percentage basketball has become a standard tool in modern player evaluation because it works. It captures scoring efficiency more accurately than field goal percentage, adjusts for the real value of three-pointers, and accounts for free throw volume - all in a single, easy-to-calculate number.
For coaches, it informs lineup decisions and offensive system design. For scouts, it filters large player pools and flags efficiency outliers worth investigating. For front offices, it helps separate players who produce counting stats from players who actually generate value on every possession.
If you are serious about basketball analytics, true shooting percentage basketball belongs in your standard evaluation toolkit. Pair it with shot chart data, play-by-play context, and video review - and you have a process that produces real insight, not just numbers on a spreadsheet.
Frequently Asked Questions
What is a good true shooting percentage basketball benchmark?
A TS% above 55% is generally considered solid at the NBA level, while anything above 60% is excellent. Average TS% in the NBA typically falls in the 54-57% range depending on the season. For college basketball, averages tend to run a bit lower. Always compare a player's true shooting percentage basketball against the average for their specific league and role.
How does true shooting percentage basketball differ from effective field goal percentage?
Effective field goal percentage (eFG%) adjusts field goal percentage for the added value of three-pointers but does not include free throws. True shooting percentage basketball includes free throws in the calculation. For players who draw a lot of fouls, TS% will often be noticeably higher than eFG%. For players who rarely get to the line, the two numbers tend to be fairly close.
Can you use true shooting percentage basketball for team-level analysis?
Yes. You apply the same formula using team totals - points scored, field goal attempts, and free throw attempts for the whole team. Team-level TS% is a useful way to compare offensive efficiency across different rosters or evaluate how lineup changes affect scoring output. It also helps identify whether a team's offensive issues stem from shot selection, finishing, or free throw shooting.
Does true shooting percentage basketball account for shot difficulty?
No. TS% treats every made shot as equal within its point category. A contested three-pointer counts the same as an open corner three. That is why true shooting percentage basketball works best when paired with shot chart data and video review - so you can understand whether high efficiency comes from smart shot selection or from genuine skill under pressure.
How do scouts use true shooting percentage basketball in recruitment?
Scouts use TS% as an initial filter when evaluating large player pools. Players who clear a target TS% threshold get flagged for deeper analysis. From there, scouts look at usage rate, shot location, competition level, and film to validate whether the efficiency is real and likely to translate to a new league or system. Platforms like Scouting4U integrate TS% directly into player profiles to speed up that process. You can learn more about the full recruitment workflow in our guide on how data analytics transforms basketball recruitment.
Enjoyed this article? Share it with others!
Founder & Lead Scout, Scouting4U
2x EuroLeague champion with 30+ years in professional basketball. Daniel won EuroLeague titles with Maccabi Tel Aviv, helped build the staff behind the 2007 European Championship, and has delivered 100+ professional scouting reports across 50+ leagues. If it happened in a European basketball front office, he was probably in the room. He founded Scouting4U in 2010 to bring championship-level scouting intelligence to every club.
No reviews yet. Be the first to share your experience!
Related Articles

Basketball Analysis: Elevate Game Insights with Video
Key TakeawaysSystematic video breakdown improves decision-making at every level of the game.Video tagging software makes...

Mastering Basketball Video Analysis for Coaches
Key TakeawaysBasketball video analysis helps coaches evaluate players and teams more accurately.Scouting4U offers advanc...
How Data Analytics Transforms Basketball Recruitment
Key TakeawaysData analytics basketball recruitment improves how scouts evaluate players with objective, repeatable metri...