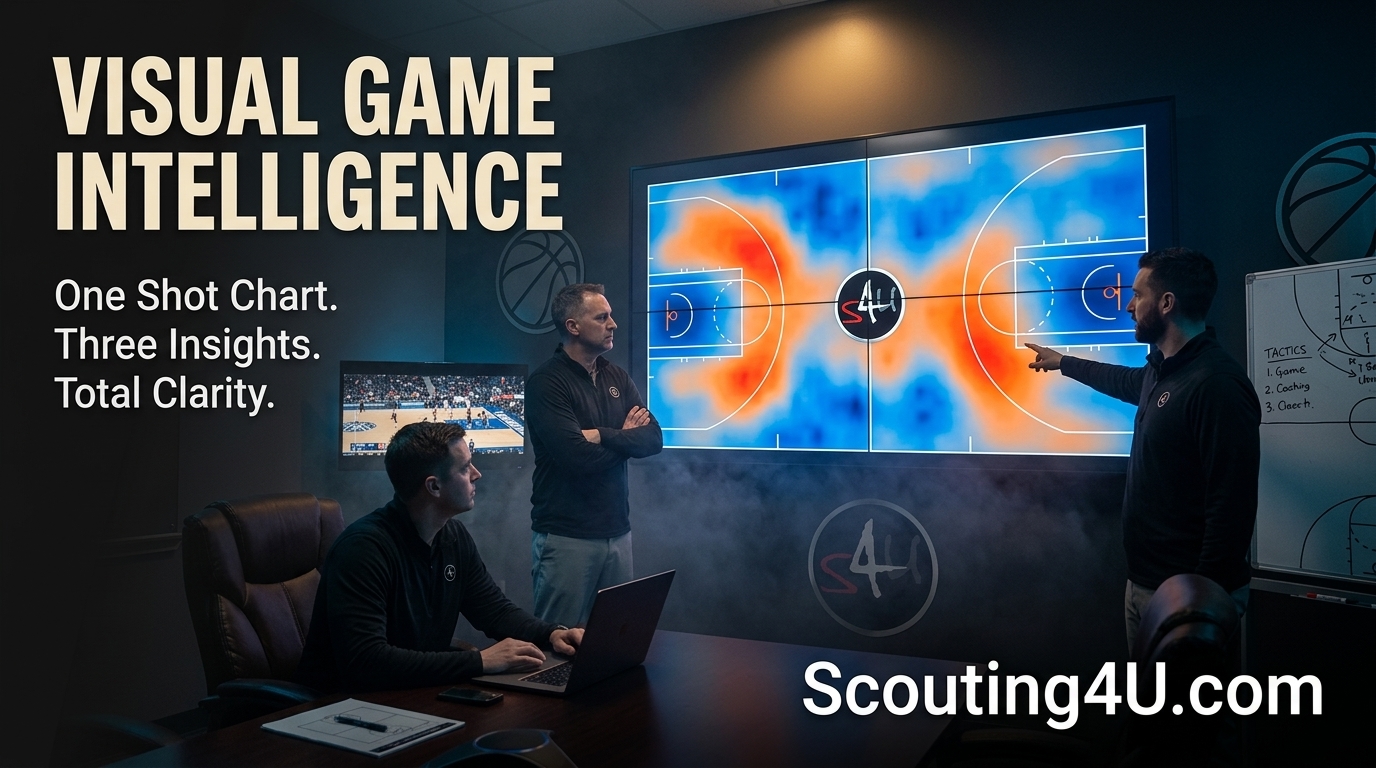
One Shot Chart. Three Insights Visual: Game Plan Revolution
Key Takeaways
A basketball shot chart three insights visual approach reveals high-efficiency zones, player tendencies, and shot selection patterns.
Shot chart data directly shapes pick-and-roll defense decisions and rotation planning.
Player-specific hot zones inform smarter lineup choices for starters and bench players alike.
Scouting4U gives coaches the tools to turn raw shot data into a full game plan.
Why a Basketball Shot Chart Three Insights Visual Changes Everything
A basketball shot chart three insights visual is one of the most practical tools in modern coaching. It shows you where shots happen, how often they go in, and what that means for your next game plan. Coaches at every level - high school, college, and professional - use shot charts to make faster, smarter decisions.
The data is right there on the court map. Red zones mean efficient shooting. Cold zones show where a player struggles. Once you learn to read that map, you stop guessing and start preparing with real evidence.
This article breaks down three concrete insights you can pull from any basketball shot chart three insights visual. Each one connects directly to something actionable - defense adjustments, rotation calls, and offensive play design. Let's get into it.
Basketball Shot Chart Three Insights Visual: Insight 1 - High-Efficiency Zone Identification
The first thing a basketball shot chart three insights visual tells you is where the efficient shots are. Not all makes are equal. A mid-range jumper at 40% efficiency is worth far less than a corner three at the same percentage. Shot charts make that gap visible.
When you map shooting percentage by zone, patterns show up fast. Some players practically live in the paint. Others only score from the left wing. The basketball shot chart three insights visual lets you see those patterns without sitting through hours of film on every possession.
How High-Efficiency Zones Shape Offense
The 2014-15 Golden State Warriors changed how teams think about shot selection. Their basketball shot chart three insights visual showed a heavy concentration of three-point attempts, especially from the corners and above the break. They didn't take that many mid-range shots because the data said those shots weren't worth it.
That logic applies at any level. If your best shooter converts 52% from the right corner, you design plays to get him there. You run actions that free up that exact spot. The basketball shot chart three insights visual doesn't just describe what happened - it tells you what to build next.
For a deeper look at reading these zones accurately, check out Reading Shot Charts Like a Pro: Zone Analysis. It walks through how to interpret court zones without over-reading small sample sizes.
Defensive Applications
High-efficiency zones matter just as much on defense. If an opponent's shooting chart shows they convert 58% of their attempts in the paint but only 31% from mid-range, your defensive scheme should push them away from the rim. The basketball shot chart three insights visual tells you exactly where to send them.
Pick-and-roll defense is a good example. Do you hedge hard, go under the screen, or switch? The answer depends partly on where the ball-handler shoots best. If the chart shows he rarely pulls up from the arc, hedging hard makes less sense. You can go under and save your energy for the roll man. That's the basketball shot chart three insights visual working in real time.
Teams that consistently use this approach are ahead of the curve. Read more about how teams that analyze P&R defense coverage win more by building their schemes around shot location data.
Basketball Shot Chart Three Insights Visual: Insight 2 - Player-Specific Shooting Tendencies
The second insight in any basketball shot chart three insights visual is individual. Every player has a shooting fingerprint. Some players are threats from three specific zones. Others are dangerous in transition but go cold in half-court sets. The chart shows you both.
This matters for scouting opponents and for managing your own roster. When you know where Player 12 on the other team scores 60% of his points, you assign your best defender to deny that space. When you know your own player shoots 44% from the left elbow but only 28% from the right, you stop calling plays to his right side.
Rotation Decisions Backed by Data
Player tendencies also drive rotation planning. A basketball shot chart three insights visual across multiple games shows you which players perform in which situations. Some bench players thrive as spot-up shooters when the defense collapses on your star. Others are liabilities in late-game half-court sets.
When you combine individual shot charts with lineup data, you start to see which five-man groups generate quality looks. A player who looks average on his individual chart might become dangerous within the right lineup because of spacing. The basketball shot chart three insights visual gives you that context - you just need to apply it.
For a full framework on using this data in lineup decisions, see Optimize Your Basketball Rotation: Starters vs Bench. It covers how to balance your rotation based on both individual efficiency and lineup fit.
Spotting Tendencies Before They Hurt You
The basketball shot chart three insights visual also flags tendencies that aren't obvious from box scores. A player might average 14 points per game, but his shot chart shows 70% of those points come from three specific areas. If you take those zones away, you neutralize him even if he's still technically "on the floor."
This is exactly the kind of pre-game intelligence that separates prepared coaches from reactive ones. You don't need to watch every minute of film if the basketball shot chart three insights visual already tells you where the danger lives.
Basketball Shot Chart Three Insights Visual: Insight 3 - Shot Selection Patterns Over Time
The third insight is about trends, not snapshots. A single game's shot chart is useful. A five-game shot chart is a pattern. That pattern tells you whether a team is adjusting to you or whether they run the same actions regardless of the defense they face.
Teams that avoid this trap understand how to read trends versus single-game data. There's a reason analysts track shot selection over multiple games - one bad night can skew a single chart completely. For more on how to avoid that mistake, Basketball Scouting Trends vs Snapshots: Avoiding Common Pitfalls is worth reading before you build your game plan.
Connecting Shot Charts to Possession Analysis
The basketball shot chart three insights visual becomes even more useful when you connect it to possession data. Where did a shot come from? Was it off a transition opportunity, a half-court set, or an offensive rebound? Context changes everything.
A team that shoots 48% in transition but only 39% in half-court situations looks different once you see the possession breakdown. You might decide to slow the tempo and force them into half-court offense. That's not a guess - that's the basketball shot chart three insights visual plus possession context working together.
Learn how to build that full picture with Possession Analysis 101: Transition, Half-Court, Second Chance. It connects shot location data to the broader flow of a game.
Using Trends to Predict, Not Just Describe
When you track the basketball shot chart three insights visual across a full season, predictive patterns emerge. Does a team's shot distribution change in close games? Do they abandon the three-point line when down by double digits? Do certain players take more pull-up jumpers in the fourth quarter?
These are preparation questions, and the shot chart answers them. You stop reacting and start anticipating. That's the difference between a reactive game plan and a prepared one.
If you want to go deeper on how advanced metrics connect to shot chart data, Advanced Basketball Statistics: Must-Know Metrics covers the numbers that matter most alongside spatial data.
Putting All Three Insights Together
The basketball shot chart three insights visual is most powerful when all three insights work together. You identify high-efficiency zones, map individual player tendencies, and track how shot selection patterns shift over time. Each layer adds context to the others.
A coach who only uses zone data might design a great defensive scheme but miss that a specific player is a counter-trend outlier. A coach who only tracks individual tendencies might miss the team-level pattern that reveals an opponent's true offensive identity. The basketball shot chart three insights visual brings it all together into one frame.
This is what separates thorough preparation from surface-level analysis. You're not just looking at where shots landed. You're building a picture of how an opponent plays and where your team can exploit them.
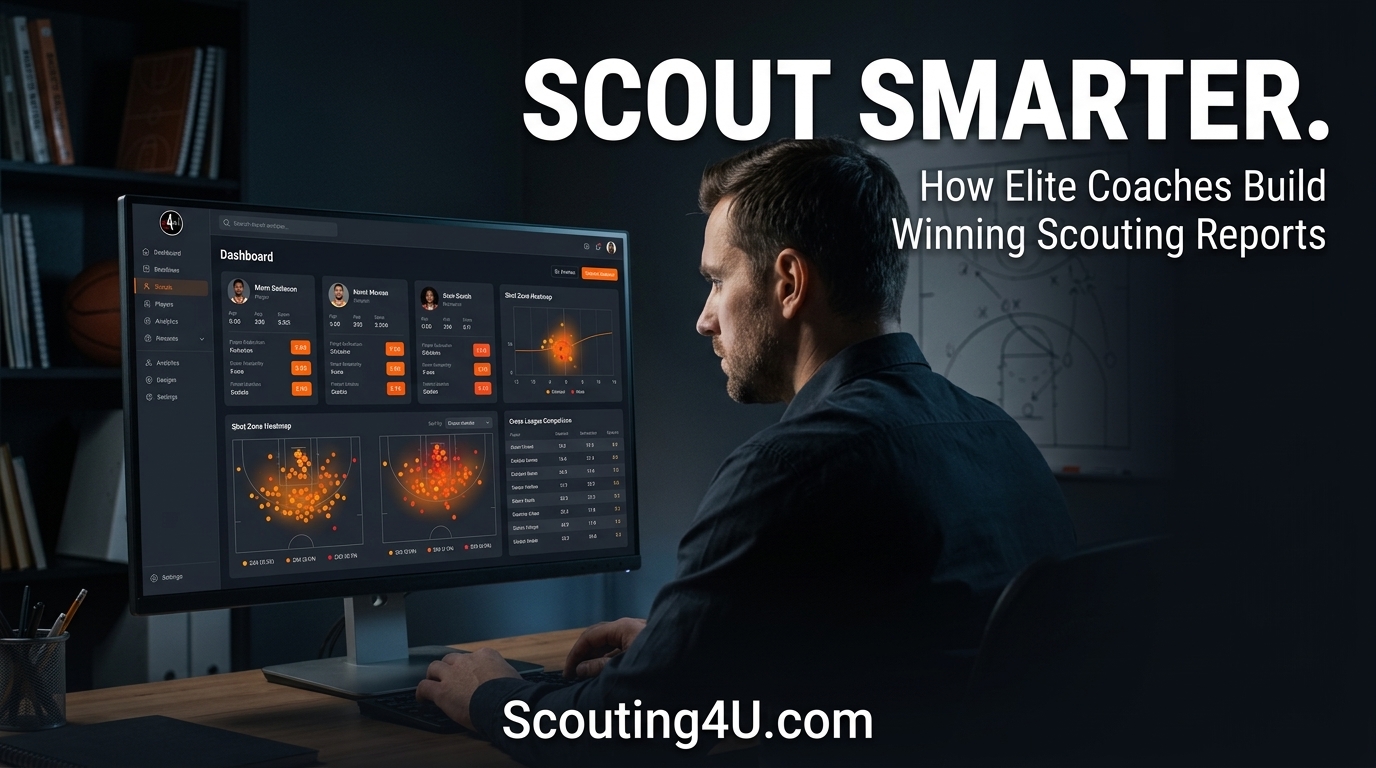
How Scouting4U Supports Basketball Shot Chart Three Insights Visual Analysis
Scouting4U is built for exactly this kind of work. The platform lets coaches generate basketball shot chart three insights visual reports quickly, without needing a dedicated analytics staff. You can filter by player, game, or date range - and the charts update automatically as you add game data.
The tools on the platform connect shot chart data to broader scouting reports, so you're not looking at numbers in isolation. Zone efficiency connects to player profiles. Shooting trends connect to rotation suggestions. It's all in one place.
Explore the full range of tools at Scouting4U platform features and see how the shot chart module fits into a complete scouting workflow. If you're ready to start, the subscription plans and pricing page breaks down what's available at each level.
You can also request a live demo through the contact page if you want to see the basketball shot chart three insights visual tools in action before committing.
Conclusion
One shot chart can tell you three things that actually change how you prepare. The basketball shot chart three insights visual approach - zone efficiency, player tendencies, and shot selection trends - gives coaches a real framework for building game plans on evidence rather than instinct.
The teams that use this kind of data consistently make better defensive assignments, smarter rotation calls, and more targeted offensive designs. That's not a theoretical benefit. It shows up in actual game outcomes when preparation meets execution.
Start with one chart. Pull three insights. Build your plan from there.
Frequently Asked Questions
What exactly is a basketball shot chart three insights visual?
A basketball shot chart three insights visual is a court map showing where shots were attempted and made, analyzed through three specific lenses: zone efficiency, individual player tendencies, and shot selection patterns over time. Together, these three angles give coaches a complete picture of offensive behavior rather than just raw shooting percentages.
How do you avoid misreading a shot chart with a small sample size?
Small samples distort zone data quickly. A player who goes 3-for-4 from the left corner in one game looks elite on a single-game chart but may be a below-average shooter there over a full season. Always look at multi-game shot charts before drawing conclusions, and weight your analysis toward zones with at least 10-15 attempts.
Can shot charts help with pick-and-roll defense decisions?
Yes, directly. If the ball-handler's basketball shot chart three insights visual shows weak pull-up shooting from the arc but strong scoring at the rim, you go under screens instead of hedging hard. That saves your defense energy and channels the offense into lower-percentage situations. The chart tells you which coverage fits each opponent.
How does the basketball shot chart three insights visual connect to rotation planning?
Player-specific shot charts show where each player is efficient across different game situations. When you layer that data over lineup combinations, you can identify which substitution patterns generate the best shot quality for your team. A bench player might have a modest individual chart but create open corner threes for teammates when paired with the right starters.
Is this kind of analysis only useful for professional or high-level teams?
No. The basketball shot chart three insights visual works at any competitive level where shooting data is tracked. College programs, semi-professional leagues, and even organized amateur teams benefit from understanding zone efficiency and player tendencies. The analytical process is the same - the sophistication of the tools just scales with the budget and staff available.
Enjoyed this article? Share it with others!
Founder & Lead Scout, Scouting4U
2x EuroLeague champion with 30+ years in professional basketball. Daniel won EuroLeague titles with Maccabi Tel Aviv, helped build the staff behind the 2007 European Championship, and has delivered 100+ professional scouting reports across 50+ leagues. If it happened in a European basketball front office, he was probably in the room. He founded Scouting4U in 2010 to bring championship-level scouting intelligence to every club.
No reviews yet. Be the first to share your experience!
Related Articles
How Do Coaches Prepare Scouting Reports?
Basketball Scouting Report Poll Coaches: How Coaches Actually PrepareEvery basketball scouting report poll coaches parti...

Rookie Player Profile: Get Scouted Online Easily
Key TakeawaysSetting up a rookie player profile to get scouted online is the most direct path to visibility in today's m...

Basketball Scouting Trends vs Snapshots Tip: Avoiding Common Pitfalls
Key TakeawaysThe basketball scouting trends vs snapshots tip comes down to one thing: patterns beat isolated data every ...