Basketball Shot Chart Analysis: Transform Data into Insights
Key Takeaways
Basketball shot chart analysis is essential for understanding shooting efficiency across every level of the game.
Advanced statistics like true shooting percentage give you a clearer picture than basic field goal percentage.
Tools like Scouting4U make basketball shot chart analysis faster and more accurate for coaches and scouts.
Historical context shows how far shot chart methodology has come - from hand-drawn diagrams to live tracking data.
Combining shot charts with player efficiency ratings gives scouts and coaches a real edge in decisions.
Introduction to Basketball Shot Chart Analysis
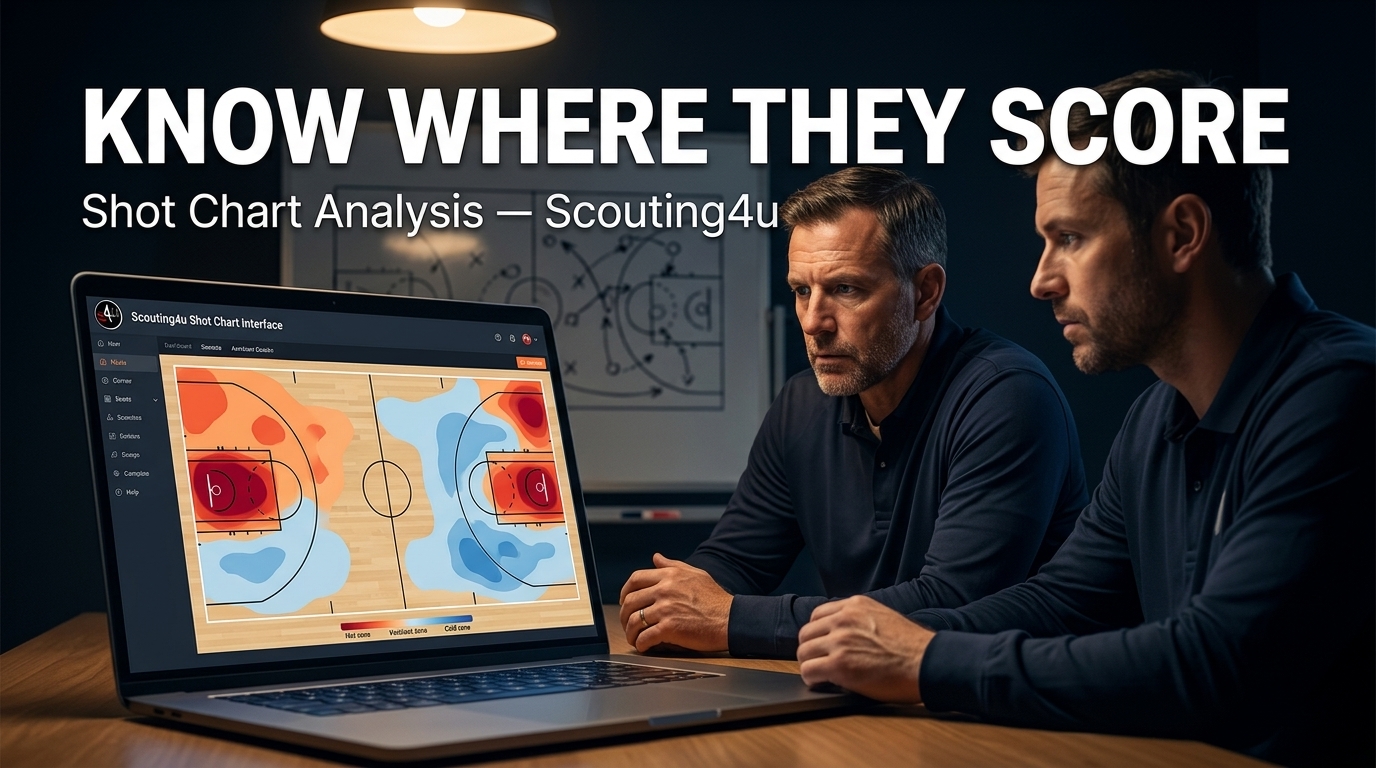
Basketball shot chart analysis has become one of the most practical tools in the modern game. It turns raw shooting data into a visual map that tells a story - where a player scores, where they miss, and what tendencies define their game. Coaches use it before games to prepare defenses. Scouts use it to evaluate prospects. Front offices use it to make roster decisions.
In this guide, we break down what basketball shot chart analysis actually involves, how it connects to other analytics, and how to put it to work at any level of the sport. Whether you are a head coach trying to stop an opponent's best scorer or a scout building a profile on a European prospect, shot charts belong in your process.
Understanding the Basics of Basketball Shot Chart Analysis
At its core, basketball shot chart analysis means plotting every shot attempt on a court diagram, recording where it came from and whether it went in. That sounds simple. But the information that comes out of it is anything but simple.
A shot chart shows you shot location, shot frequency, and shooting percentage by zone. You can see at a glance that a player makes 48% of their shots from the left elbow but only 29% from the right corner. That kind of detail changes how you guard them. It also changes how you coach them in practice.
The most useful shot charts break the court into zones. Common zones include the restricted area, the mid-range areas on each side, the high post, and the three corners plus above-the-break three-point locations. Some systems go further and use hexagon-based heat maps that show shot frequency relative to league averages. The more granular the zone breakdown, the more useful the basketball shot chart analysis becomes for tactical decisions.
Modern platforms pull this data automatically from tracking systems or video tags. A decade ago, a coach or analyst had to log every attempt by hand. Today, software does that work, which means you spend more time acting on the data and less time collecting it.
Advanced Statistics That Make Basketball Shot Chart Analysis More Powerful
Shot location data alone is useful. But when you layer advanced statistics on top of it, basketball shot chart analysis becomes a much sharper tool.
True Shooting Percentage
True shooting percentage (TS%) adjusts for the fact that three-pointers and free throws are worth different amounts than standard two-point field goals. A player who shoots 44% from the field but gets to the line constantly might actually be more efficient than a player shooting 48% who never draws fouls. TS% captures that difference.
When you map TS% onto a shot chart by zone, you get a clear view of where a player is genuinely efficient versus where they are just taking shots. That distinction matters a lot. A mid-range jump shot at 42% sounds decent until you compare it to what that player could generate from other spots on the floor.
Player Efficiency Rating
Player Efficiency Rating (PER) compresses a player's entire statistical contribution into one number. On its own, PER does not tell you where a player scores best. But when you cross-reference PER with basketball shot chart analysis, you start to see which shot selection patterns actually drive overall performance. A high-PER player who generates most of their value near the rim has a very different profile from a high-PER player who thrives in pick-and-roll situations at the three-point line.
For a full breakdown of how PER works, read Basketball PER Rating Explained: Insights & Use Cases. It pairs well with shot chart data in any evaluation workflow.
Shot Quality Metrics
Some analytics systems now assign a shot quality score to each attempt. This score estimates the expected points per shot based on location, contest level, and game situation. When you build this into your basketball shot chart analysis, you can separate players who take good shots from players who just shoot a lot. That difference shows up clearly in team performance over a long season.
The Historical Evolution of Basketball Shot Chart Analysis
Basketball shot chart analysis has changed dramatically over the past 40 years. The concept itself is older than most people realize. Coaches in the 1970s and 1980s used paper diagrams to manually track shot locations during games. The process was slow, prone to error, and limited by whoever was doing the charting. Still, those early charts gave coaches information they could not get any other way.
In the 1990s, teams began digitizing the process. Basic software allowed analysts to log shot data more quickly and generate simple visual reports. The problem was that the data still required manual input from someone watching film, which meant it was time-consuming and not always consistent across different analysts.
The real shift came with player tracking technology. Systems like SportVU, and later Second Spectrum, placed cameras in arenas that tracked every player and the ball at 25 frames per second. This gave teams shot location data for every attempt in every game, with a level of detail that hand-charting could never match. Suddenly, basketball shot chart analysis moved from a scouting supplement to a central pillar of team strategy.
Today, even teams without access to arena-level tracking systems can do serious basketball shot chart analysis through video tagging platforms that automate much of the data collection process. The technology has democratized access to the kind of analysis that used to require a dedicated analytics department.
Basketball Analytics Software and What to Look For
The right software makes basketball shot chart analysis faster, more consistent, and easier to share across a coaching staff. There are a few things that separate useful platforms from ones that just look impressive in a demo.
First, look for customizable zones. Every coach thinks about the court differently. A system that forces you into preset zones will eventually feel limiting. The best tools let you define zones that match your defensive scheme or your offensive playbook.
Second, look for filtering options. You need to be able to isolate shot data by game type, by opponent, by quarter, and by lineup. A season-long shot chart for a player tells you something. But a shot chart for that same player in fourth-quarter situations against zone defenses tells you much more.
Third, the platform should connect shot chart data to video. When you can click on a shot location and immediately pull up the video clip of that attempt, basketball shot chart analysis stops being abstract and becomes concrete. You see exactly what the defensive breakdown was, or exactly how the offense created the shot.
Scouting4U builds all of this into its platform. You can explore the full set of tools at Scouting4U platform features and tools. The platform is built for scouts and coaches who need fast, accurate analysis without hiring a full analytics team.
Integrating Basketball Shot Chart Analysis with Player Evaluation
Shot charts are most useful when they sit inside a broader evaluation framework. On their own, they show you shooting patterns. When you connect them to scouting reports, defensive data, and play-by-play breakdowns, they become part of a complete player profile.
In recruitment, basketball shot chart analysis helps scouts identify players whose shot selection matches what a team needs. A team that runs a lot of pick-and-roll wants a ball-handler who converts well from pull-up situations in the mid-range or at the rim. A team that spaces the floor wants shooters who make above-the-break threes at a high rate. Shot charts make those fit questions answerable with data rather than gut feel.
For a deeper look at how shot chart data fits into scouting workflows, Inside an NBA Scouting Department: Talent Evaluation walks through how professional organizations structure their evaluation processes. The principles there apply at the college and even high school level.
Player development is another area where basketball shot chart analysis delivers clear value. When a player sees their own shot chart, they understand their tendencies in a way that verbal feedback alone cannot produce. A point guard who shoots 23% on pull-up twos from the left side of the key but 41% on catch-and-shoot threes may not realize that pattern exists until they see it mapped out. Once they see it, they can start making better decisions in real time.
Shot charts also work well alongside play-by-play data. If you want to understand not just where a player shoots but what situations lead to those shots, you need both layers. Read more on how play-by-play data complements shot chart work in Basketball Play-by-Play Analysis: Maximizing Game Insights.
Practical Applications for Coaches
Basketball shot chart analysis is not just for scouts and analysts. Coaches at every level can use it in concrete ways before, during, and after games.
Game Preparation
Before facing an opponent, pull their shot chart for the last ten games. Identify where their top scorers are most dangerous and where their weaknesses are. Build your defensive game plan around those patterns. This is more precise than watching film alone because it removes the noise of individual plays and shows you real tendencies over a large sample.
For example, if an opponent's point guard shoots 38% on right-side pull-up threes but only 24% on left-side pull-ups, you have a clear directive for your defenders: push him left. That single adjustment, grounded in basketball shot chart analysis, can change the outcome of a game.
Lineup Optimization
Shot charts help coaches figure out which lineups create the best shot quality for their team and the worst shot quality for opponents. When you track shot charts by lineup rather than by individual player, you can see which combinations open up the restricted area, which ones generate corner threes, and which ones force opponents into low-percentage mid-range attempts.
This kind of lineup-level basketball shot chart analysis connects directly to how you manage rotations. It moves decisions from intuition to evidence.
In-Season Player Development
Sharing shot chart data with players during practice creates better decision-makers. When players understand their own tendencies, they can work on weak spots and lean into strengths. Coaches who do this regularly see faster improvement than those who rely on verbal instruction alone.
Common Mistakes in Basketball Shot Chart Analysis
The biggest mistake is treating a small sample as conclusive. A player's shot chart from three games tells you almost nothing reliable. You need at least 10-15 games before zone-level shooting percentages start to stabilize. Acting on a three-game sample can lead to bad defensive adjustments or unfair player evaluations.
The second common mistake is ignoring context. A shot chart does not tell you whether shots were contested or open, whether they came late in the shot clock, or whether they were the result of broken plays. You need video alongside your basketball shot chart analysis to interpret what you are actually seeing.
Third, coaches sometimes focus only on where players miss rather than where they score. Shot chart analysis should be about finding opportunities, not just avoiding bad shots. A player who scores at a high rate from the left block deserves to run more plays to that spot. That is just as important as cutting out low-efficiency attempts.
Conclusion
Basketball shot chart analysis is one of the most direct ways to turn observation into strategy. It gives coaches a factual basis for defensive schemes. It gives scouts a clear picture of a player's real tendencies rather than a highlight-reel impression. It gives players a mirror that shows them exactly how they perform across the court.
The methodology has matured enormously, but the core question it answers has always been the same: where does this player score, and what does that tell us? The teams and coaches who use basketball shot chart analysis consistently - not just occasionally - are the ones who make better decisions over a long season. That edge compounds over time.
If you want to see how a dedicated platform handles basketball shot chart analysis at scale, request a demo from Scouting4U and see what the workflow looks like in practice.
Frequently Asked Questions
What is basketball shot chart analysis?
Basketball shot chart analysis is the process of mapping shot attempts on a court diagram by location and outcome. It shows where a player or team shoots from, how often, and at what percentage. Coaches and scouts use this data to identify tendencies, build game plans, and evaluate players more accurately than box score stats allow.
How many games do you need for reliable basketball shot chart analysis?
As a general rule, you need at least 10 to 15 games before zone-level shooting percentages become meaningful. Smaller samples can show you rough tendencies, but percentages from three or four games are too unstable to base decisions on. The more games in the sample, the more confident you can be in what the chart is telling you.
What is the difference between a heat map and a standard shot chart?
A standard shot chart shows individual shot locations as dots or symbols on a court diagram. A heat map aggregates those shots by zone and uses color intensity to show frequency or efficiency relative to a baseline - often league average. Heat maps are easier to read at a glance. Standard charts preserve the exact location of each attempt, which is useful for detailed film review alongside basketball shot chart analysis.
Can basketball shot chart analysis be used at the youth or high school level?
Yes, and it is increasingly accessible at those levels. Video tagging software has made it possible for coaches without large staffs to generate shot chart data from game film. Even a basic zone chart manually logged during a game gives a high school coach useful information for scouting opponents and developing players.
How does shot chart analysis connect to defensive scouting?
Shot charts are one of the most direct tools in defensive preparation. By studying an opponent's chart, a coaching staff can identify which zones to protect, where to steer ball-handlers, and which players are genuine shooting threats versus those who shoot a lot but inefficiently. This is the core of how basketball shot chart analysis translates into defensive game planning at every level of the sport.
Enjoyed this article? Share it with others!
Founder & Lead Scout, Scouting4U
2x EuroLeague champion with 30+ years in professional basketball. Daniel won EuroLeague titles with Maccabi Tel Aviv, helped build the staff behind the 2007 European Championship, and has delivered 100+ professional scouting reports across 50+ leagues. If it happened in a European basketball front office, he was probably in the room. He founded Scouting4U in 2010 to bring championship-level scouting intelligence to every club.
No reviews yet. Be the first to share your experience!
Related Articles

Basketball Analysis: Elevate Game Insights with Video
Key TakeawaysSystematic video breakdown improves decision-making at every level of the game.Video tagging software makes...
Mastering Basketball Video Analysis for Coaches
Key TakeawaysBasketball video analysis helps coaches evaluate players and teams more accurately.Scouting4U offers advanc...

True Shooting Percentage Basketball: Calculation & Insights
Key TakeawaysTrue shooting percentage basketball offers a comprehensive efficiency metric that goes beyond simple field ...