
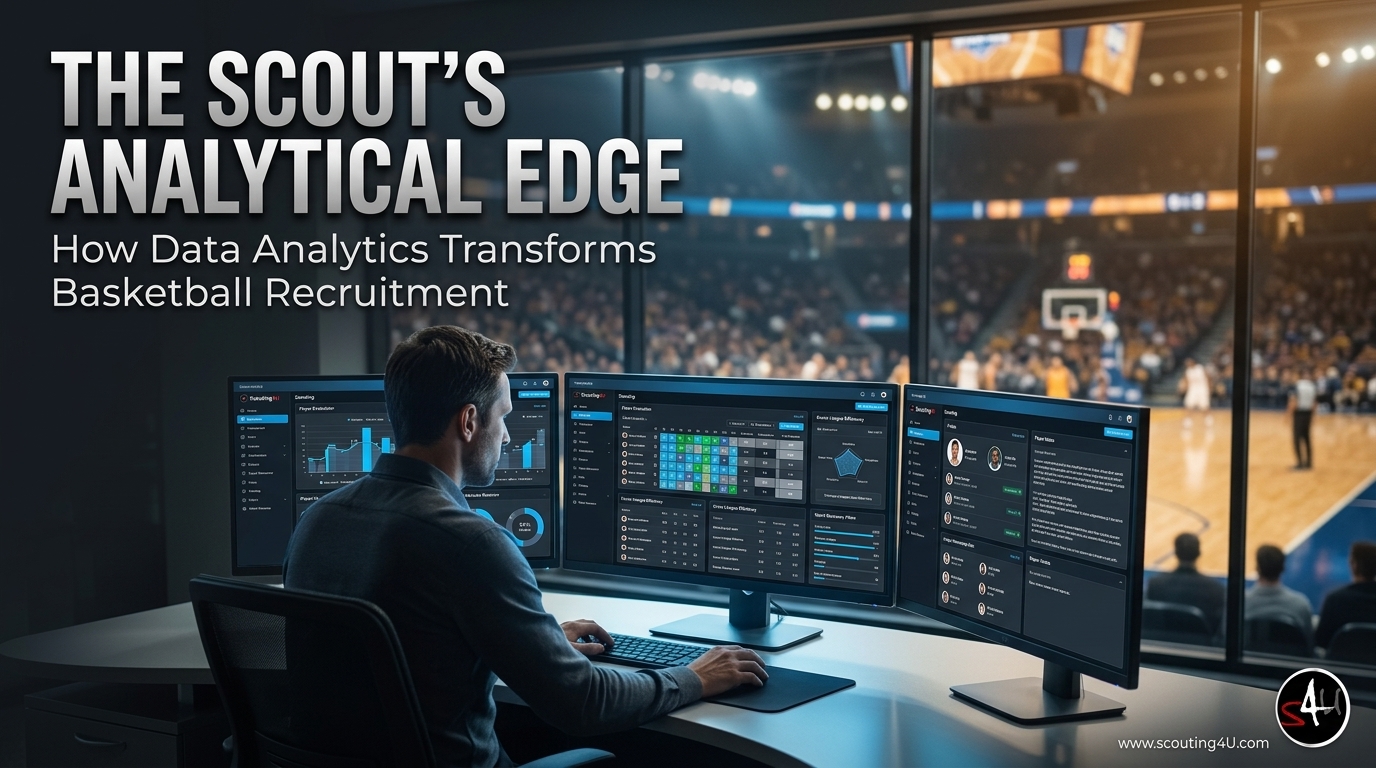
How Data Analytics Transforms Basketball Recruitment
Key Takeaways
Data analytics basketball recruitment improves how scouts evaluate players with objective, repeatable metrics.
Advanced stats like PER, TS%, and Offensive Rating give context that the eye test alone cannot provide.
Scouting4U offers purpose-built tools for scouts who need speed and accuracy in their recruitment workflow.
Analytics can bridge scouting gaps between European and American basketball systems.
Daniel Gutt's background in EuroLeague scouting shaped how Scouting4U approaches data-driven recruitment.
Introduction: How Data Analytics Basketball Recruitment Is Changing the Game
Data analytics basketball recruitment has moved from a niche experiment to an industry standard. Scouts who once relied entirely on their instincts and a notepad now have access to player efficiency ratings, shot charts, and tracking data - all updated in near real time. That shift changes everything about how teams identify, evaluate, and sign players. This guide walks through why analytics matters, which metrics carry the most weight, how video analysis fits into the picture, and what tools actually help recruitment teams do their jobs better.
Why Data Analytics Basketball Recruitment Outperforms Traditional Scouting Alone
Traditional scouting has real strengths. An experienced scout reads body language, sees how a player responds to pressure, and picks up on details that no camera captures. But it also has limits. Human observation is inconsistent. Two scouts watching the same game often disagree. And no one can watch every prospect across every league.
Data analytics basketball recruitment solves that scaling problem. Metrics do not get tired on a red-eye flight or miss a key play because they checked their phone. A player's True Shooting Percentage (TS%) is the same whether you watched the game live or pulled the box score three weeks later. That consistency is the foundation analytics brings to recruitment.
There is also the issue of context. A player averaging 18 points per game sounds impressive. But data analytics basketball recruitment asks harder questions. What was the competition level? What was the pace of play? Did the team run plays specifically to inflate that number? Metrics like Usage Percentage (USG%) and Offensive Rating (ORTG) help answer those questions before a team makes a costly roster decision.
The Metrics That Actually Drive Data Analytics Basketball Recruitment
Not all statistics are equally useful in a recruitment context. Box score numbers - points, rebounds, assists - are a starting point, not a conclusion. The metrics below carry more weight in modern data analytics basketball recruitment.
Player Efficiency Rating (PER) was developed by John Hollinger and gives a per-minute assessment of a player's overall productivity. It normalizes output across different playing-time splits, which makes it easier to compare a bench player in Turkey with a starter in Spain.
True Shooting Percentage (TS%) accounts for the value of three-pointers and free throws, not just field goals. A player shooting 44% from the field but getting to the line constantly may actually be more efficient than someone shooting 48% with no free throw attempts.
Offensive and Defensive Rating (ORTG/DRTG) measure how many points a team scores or allows per 100 possessions when a specific player is on the court. These team-context metrics help scouts see whether a player actually improves a lineup or just benefits from being around better teammates.
Usage Percentage (USG%) tells you how often a player is involved in a team's possessions. Combined with efficiency metrics, it separates high-volume scorers from genuinely productive ones. A player with a 32% usage rate and elite TS% is rare. That combination is exactly what data analytics basketball recruitment is designed to surface.
For a deeper breakdown of these and other stats, the guide on advanced basketball statistics and must-know metrics is worth reading in full before your next scouting cycle.
Shot Chart Analysis in Data Analytics Basketball Recruitment
Shot charts are one of the most visual tools in data analytics basketball recruitment. They show where on the court a player takes shots and what percentage they make from each zone. At a glance, a scout can see whether a wing player is a genuine mid-range threat or just a catch-and-shoot specialist from the corner.
That distinction matters for roster building. A team running a high pick-and-roll offense needs a forward who can threaten from the elbow. A shot chart confirms whether a prospect actually does that - or only looks like they do from watching highlights.
Shot chart data also reveals tendencies that a player may not even be aware of. Some players gravitate to one side of the floor out of habit. Others avoid the right corner three even when it is open. These patterns show up clearly in the data, and they inform both recruitment decisions and post-signing development plans.
To get more from shot chart data, see the detailed walkthrough on basketball shot chart analysis and how to turn data into insights.
How Video Analysis Fits Into Data Analytics Basketball Recruitment
Numbers explain what happened. Video explains why. That combination is what makes data analytics basketball recruitment genuinely powerful when both are used together.
Say a scout notices a prospect has an unusually low assist-to-turnover ratio. The stat flags a problem. But video reveals the cause - maybe the player forces difficult passes under pressure, or maybe they play with poor passers who cannot catch clean feeds. Those are very different problems with different implications for recruitment.
Video tagging platforms speed up this process by letting scouts attach metadata to specific clips. You can tag a play as a "pick-and-roll defense" or "pull-up three" and then filter across hundreds of hours of footage instantly. That turns what used to be a week of film study into an afternoon. Efficient game film analysis is now a standard part of data analytics basketball recruitment at every serious level of the sport.
Teams that combine automated stat pulls with organized video libraries have a real edge. They can answer questions faster, compare more players in less time, and make decisions with more supporting evidence.
Bridging European and American Styles Through Data Analytics Basketball Recruitment
One of the less-discussed uses of data analytics basketball recruitment is cross-market scouting. European and American basketball developed separately, and the stylistic differences still show up in how players are built and what roles they are asked to fill.
A European-trained big man who thrives in Spain's Liga ACB might look like a below-average rebounder on raw numbers because the pace and style of play differ from the NBA. Data analytics basketball recruitment corrects for that by normalizing statistics across leagues. Pace-adjusted metrics and league-relative percentiles let scouts compare a center in Greece to one in the G League without just eyeballing totals.
Daniel Gutt, who founded Scouting4U after years in EuroLeague scouting, built the platform with exactly this challenge in mind. Teams crossing markets need data that travels across systems - not just highlights and gut feelings. For context on the stylistic differences that scouts navigate, the analysis of European and American basketball styles covers the tactical and cultural gaps that analytics can help close.
What Scouting4U Brings to Data Analytics Basketball Recruitment
Scouting4U is built specifically for professional scouts and recruitment teams. It is not a general sports analytics tool repurposed for basketball. The platform pulls in advanced metrics, integrates video tools, and generates AI-assisted scout reports - all within one workflow.
For teams that scout across multiple leagues, that integration matters. Switching between five different tools to evaluate one player wastes time and introduces errors. Scouting4U centralizes data analytics basketball recruitment into a single environment where you can compare players, review shot charts, annotate video, and share reports across your staff.
The platform also reflects Gutt's background on the European circuit. It handles multi-league databases, supports different statistical frameworks, and is designed for scouts who are actually moving across borders - not just analyzing the NBA from a single office.
If you want to see the full tool set before committing, the Scouting4U platform features page lists what is available at each tier, and the pricing and subscription options break down what each plan includes.
Building a Recruitment Process Around Data Analytics
Having access to analytics is one thing. Building a repeatable recruitment process around it is another. Most front offices that struggle with data analytics basketball recruitment do not have a data problem - they have a workflow problem. The data exists. They just cannot use it consistently.
A functional analytics-driven recruitment process starts with a clear player profile. What role does the team need to fill? What are the non-negotiable metrics for that role? A backup point guard who can run the offense efficiently at the end of close games has a very different stat profile from a wing scorer who starts.
Once that profile exists, the scouting database can filter candidates quickly. Data analytics basketball recruitment then shifts from "watch everyone and see who stands out" to "here are 12 players who fit the profile - now go watch them." That targeted approach saves weeks of unfocused film time.
After narrowing the list through data, video fills in the gaps. What does this player do when the play breaks down? How do they defend in transition? Are they coachable on the floor, adjusting within games? Those questions require watching. But data got you to the right players first.
The Limits of Data Analytics Basketball Recruitment
Analytics is a tool, not an oracle. Data analytics basketball recruitment improves decision-making - it does not guarantee good decisions.
Small sample sizes are a constant issue, especially in international scouting. A player who appeared in 12 league games has metrics, but those metrics are unreliable. Scouts need to know which numbers to trust and which to treat as directional signals only.
Injury history and physical durability do not always show up in stats until it is too late. A player can put up excellent numbers in limited minutes while hiding a chronic knee issue. Medical evaluations remain a critical part of the recruitment process that analytics cannot replace.
Culture fit and character assessment also sit outside what data can measure. Two players with identical PER scores can have completely different locker room impacts. Experienced scouts know that data analytics basketball recruitment is most effective when it informs the conversation with coaches and team staff - not when it ends it.
Conclusion: Making Data Analytics Basketball Recruitment Work for Your Team
Data analytics basketball recruitment is now table stakes at the professional level. Teams that ignore it are not being loyal to traditional scouting - they are just operating with less information than their competitors.
The goal is not to replace scout judgment with spreadsheets. It is to make sure that judgment is applied to the right players, with better context, and with more supporting evidence. That is what good data analytics basketball recruitment actually looks like in practice.
Start with the metrics that matter for your system. Build a player profile before you start searching. Use shot charts and video to confirm what the numbers suggest. And use platforms that centralize the workflow rather than fragmenting it across tools.
Teams that connect analytics to decisions - rather than just collecting data - are the ones that consistently find players other organizations miss.
Frequently Asked Questions
What is data analytics basketball recruitment?
Data analytics basketball recruitment is the practice of using advanced metrics, statistical models, and analytics platforms to evaluate and identify players for recruitment. It replaces or supplements subjective observation with objective, repeatable data points - like PER, TS%, and ORTG - to improve the quality and consistency of recruitment decisions.
Which metrics are most important in data analytics basketball recruitment?
The most widely used metrics include Player Efficiency Rating (PER), True Shooting Percentage (TS%), Offensive and Defensive Rating (ORTG/DRTG), and Usage Percentage (USG%). Each measures a different aspect of performance. The right combination depends on the role you are scouting for and the system your team runs.
How does video analysis work alongside data analytics basketball recruitment?
Data shows what happened - video shows why. In practice, scouts use analytics to filter and rank prospects, then use video to confirm or challenge what the numbers suggest. Video tagging tools speed up film review by letting scouts organize and search footage by play type, making the two methods faster to use together than separately.
Can data analytics basketball recruitment work for international scouting?
Yes, and it is especially useful there. Pace-adjusted and league-relative metrics allow scouts to compare players across different basketball systems - EuroLeague, Liga ACB, or the G League - without being misled by raw totals that reflect style of play rather than individual quality. Platforms designed for multi-league databases, like Scouting4U, are built with this use case in mind.
What are the limits of data analytics in basketball recruitment?
Small sample sizes, injury history, and character assessment are the three areas where data falls short. A player with 12 games of data has metrics, but they are unreliable. Medical evaluations and direct conversations with coaches fill in what stats cannot. The best recruitment teams treat analytics as a starting point for deeper investigation, not a final answer.
Enjoyed this article? Share it with others!
Founder & Lead Scout, Scouting4U
2x EuroLeague champion with 30+ years in professional basketball. Daniel won EuroLeague titles with Maccabi Tel Aviv, helped build the staff behind the 2007 European Championship, and has delivered 100+ professional scouting reports across 50+ leagues. If it happened in a European basketball front office, he was probably in the room. He founded Scouting4U in 2010 to bring championship-level scouting intelligence to every club.
No reviews yet. Be the first to share your experience!
Related Articles

Basketball Analysis: Elevate Game Insights with Video
Key TakeawaysSystematic video breakdown improves decision-making at every level of the game.Video tagging software makes...
Mastering Basketball Video Analysis for Coaches
Key TakeawaysBasketball video analysis helps coaches evaluate players and teams more accurately.Scouting4U offers advanc...
True Shooting Percentage Basketball: Calculation & Insights
Key TakeawaysTrue shooting percentage basketball offers a comprehensive efficiency metric that goes beyond simple field ...