Mastering Basketball Analytics for Coaches: A Guide
Key Takeaways
Basketball analytics for coaches improves decision-making and speeds up player development.
Advanced stats like PER and TS% give deeper insight into how players actually perform.
Pairing video analysis with data makes training programs more effective.
Scouting4U gives coaches tools that cut down scouting time without cutting corners.
Data-driven strategies can surface hidden talent and sharpen team performance.
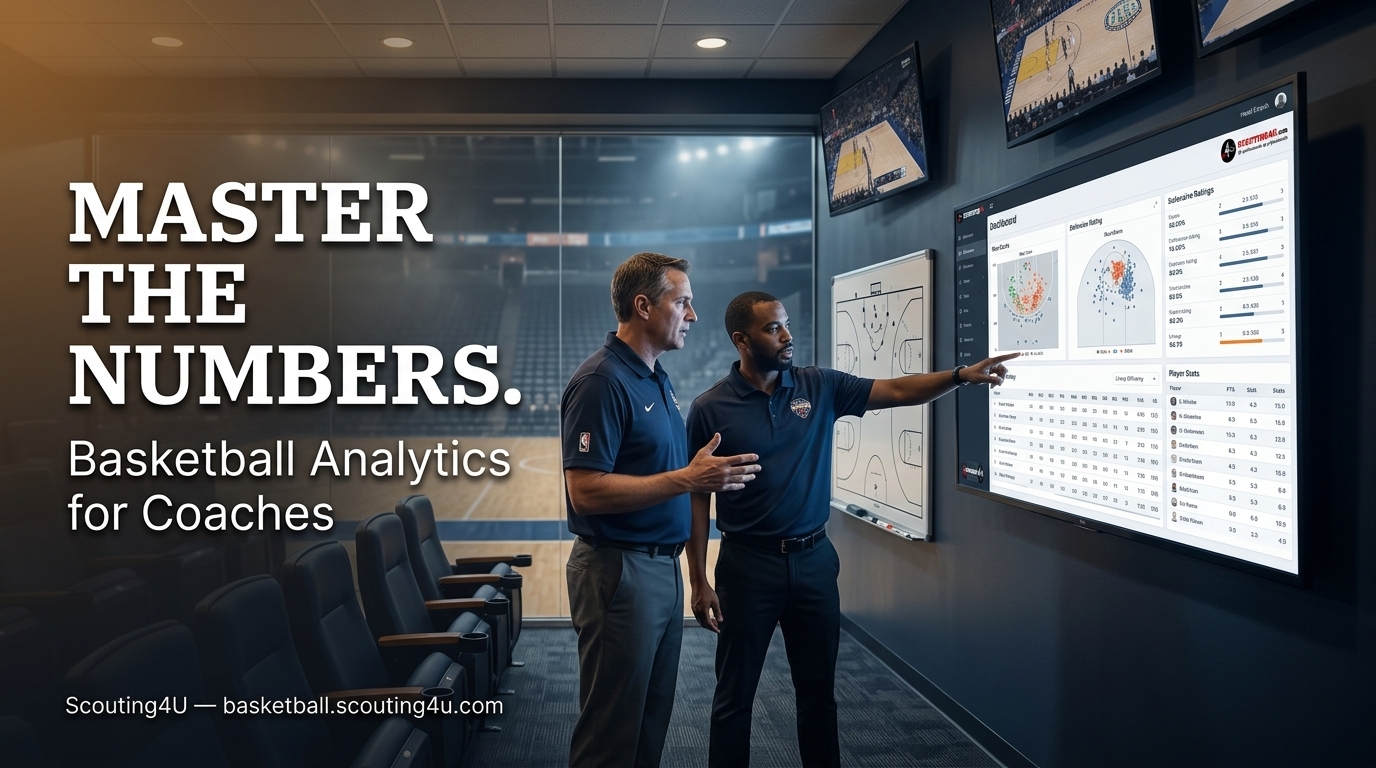
Why Basketball Analytics for Coaches Is Changing the Game
Basketball analytics for coaches has moved from a novelty to a necessity. A decade ago, most coaches relied on gut instinct and basic box scores. Now, teams at every level - high school, college, and professional - are making roster decisions, in-game adjustments, and training plans based on hard data. The shift is real, and coaches who ignore it are working with one hand tied behind their back.
The numbers alone do not win games. But they tell you things that watching film cannot. They confirm hunches, challenge assumptions, and sometimes reveal patterns that no coach would spot with the naked eye. Basketball analytics for coaches is about getting that information into your hands fast enough to act on it.
Scouting4U was built around that exact problem. The platform puts advanced data in a format that coaches can actually use - not a spreadsheet built for a data scientist, but a tool designed for someone who has a practice to run and a game on Thursday.
The Core Stats Every Coach Should Understand
Basketball analytics for coaches starts with learning which numbers actually matter. Not every metric deserves your attention. Here are the ones that do the most work.
Player Efficiency Rating (PER) rolls a player's contributions into a single number. It accounts for scoring, assists, rebounds, steals, and turnovers. A league-average PER sits around 15. Anything above 20 is a strong performer. It is a quick way to rank players across positions.
True Shooting Percentage (TS%) tells you how efficiently a player scores when you account for free throws and three-pointers. Basic field goal percentage misses the picture. TS% does not. A player shooting 44% from the field but drawing fouls regularly can have a TS% above 60% - much more valuable than the raw number suggests.
Offensive and Defensive Rating (ORTG / DRTG) measure how many points a team scores or allows per 100 possessions with a given player on the floor. These numbers are gold for lineup decisions. They show you which combinations actually work, not just which ones look good in theory.
Usage Rate (USG%) tells you what share of team possessions a player uses while on the court. A player with a 35% usage rate is handling nearly a third of his team's plays. That context changes how you evaluate his other numbers.
Mastering basketball analytics for coaches means knowing when to trust these numbers and when to question them. Context matters. A player putting up a high USG% on a weak team looks different than one posting the same rate on a championship contender. Always read the situation, not just the stat.
Integrating Video and Analytics Together
Basketball analytics for coaches gets more powerful when you pair data with video. Numbers tell you what happened. Video shows you why.
Say your DRTG data shows a specific two-man lineup giving up 12 more points per 100 possessions than your other units. That number tells you something is wrong. But watching the film shows you whether it is a communication breakdown on switches, poor positioning on ball screens, or one player getting beaten off the dribble every time. You need both pieces to fix the problem.
This is where platforms like Scouting4U earn their value. Coaches can pull up basketball player performance analysis tools that tie statistical outputs directly to film clips. Instead of hunting through hours of footage, you jump straight to the possessions the data flagged as problems. That saves preparation time and makes film sessions far more focused.
Player development works the same way. Basketball analytics for coaches can track a player's three-point percentage over a four-week training block. If the number is not moving, the video will usually show you exactly why - a hitch in the release, inconsistent footwork, or a tendency to rush on the catch. Data flags the problem; video diagnoses it.
Using Analytics to Scout Opponents More Effectively
Basketball analytics for coaches does not stop at your own roster. Opponent analysis is where it can give you the clearest competitive edge on game day.
Every team has tendencies. Some guards always drive left under pressure. Some big men only shoot mid-range jumpers when trailing by double digits. Some teams fall apart in transition defense after a made three. These patterns exist in every opponent's data. The question is whether you have the tools to find them before tip-off.
Tendency analysis is one of the most direct applications of basketball analytics for coaches at the game-planning level. You can look at where a player takes the majority of his shots, how often he attacks the basket vs. pulling up, and what he does in late-clock situations. That information shapes how you build your defensive game plan. For a closer look at how this works, basketball tendency analysis for decoding opponent patterns breaks down the process in detail.
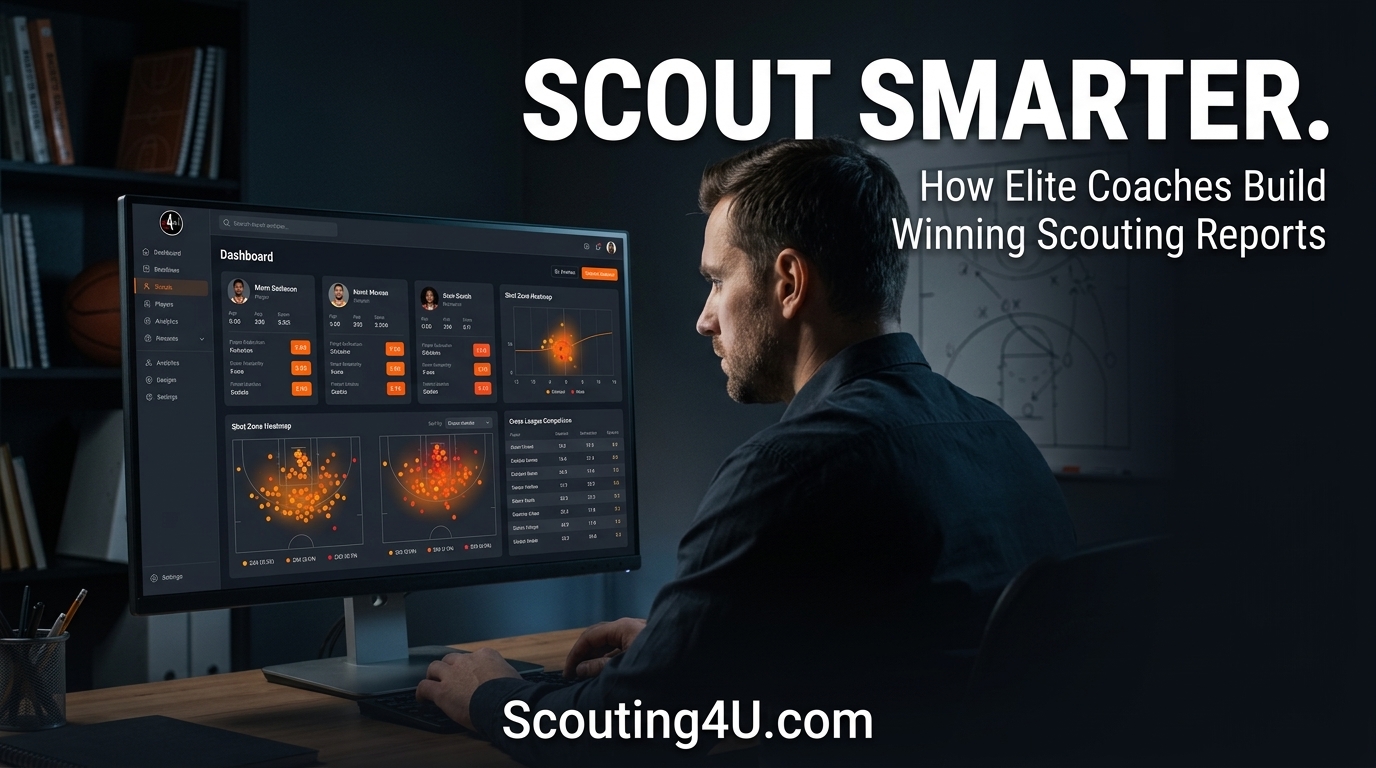
Pre-game scouting reports used to take hours to build. With the right tools, basketball analytics for coaches compresses that process significantly. A well-organized report can be ready in minutes rather than most of a workday, and it will cover more ground than a manually assembled document.
Recruitment: Finding Players Who Fit Your System
Basketball analytics for coaches shapes recruiting in ways that traditional methods simply cannot match. Watching a prospect in a single game gives you a snapshot. Data from 30 games gives you a pattern.
College coaches and professional scouts are now using analytics to identify players who fit specific system requirements. If you run a pace-and-space offense, you need players with high assist rates, low turnover rates, and strong corner three-point shooting. If you play drop coverage defensively, you want bigs with strong rebound rates and the ability to recover quickly. Analytics let you filter by these exact requirements rather than relying on reputation or highlight reels.
One of the clearest benefits of basketball analytics for coaches in recruitment is finding undervalued players. A prospect buried on a deep roster might have modest raw numbers but outstanding efficiency metrics. His USG% is low because his team has better players around him, not because he cannot perform. The data reveals that; a basic stats sheet does not. Learn more about this approach in our guide on scouting undervalued basketball players.
Roster construction is another area where analytics pays off. Building a balanced roster requires understanding how different player profiles complement each other - which is difficult to do from observation alone. Data-driven roster decisions reduce the risk of stacking similar skill sets or leaving obvious gaps in team composition. Our breakdown of basketball roster building strategies covers this in depth.
In-Game Decision Making With Real Data
Basketball analytics for coaches is not just a pre-game tool. In-game decisions benefit from data too.
Lineup optimization is one area where real-time analytics pays off fast. Which five-man unit is your best defensive group? Which lineup generates the most efficient offensive possessions? Which player matches up best against their primary scorer? These questions used to be answered by feel. Now they can be answered by your data - faster and more accurately.
Foul trouble management changes with analytics. If you know a key opponent fouled out in four of his last ten games, that tells you something about how to attack him. If your own player tends to pick up two early fouls when guarding high-usage wings, you can plan around that pattern rather than reacting to it in the moment.
Substitution timing, defensive rotations, and timeout decisions can all be informed by possesion-level data. Basketball analytics for coaches turns these calls from reactive guesses into calculated choices. That does not mean the coaching instinct goes away - it means the instinct gets better information to work with.
Getting Started Without Overcomplicating It
The biggest barrier most coaches face with basketball analytics is not the data itself. It is not knowing where to start. The volume of metrics available can feel overwhelming, especially if you are coming from a background of traditional scouting and film study.
Start with two or three metrics that connect directly to your biggest coaching priorities. If your team struggles to defend the paint, focus on DRTG and opponent paint points. If you are trying to improve offensive efficiency, start with TS% and turnover rate. Build your analytics habit around the problems you already know you have.
Basketball analytics for coaches works best when it becomes part of your regular workflow - not a separate task you do on Sunday nights. The goal is to have data available when you need it, in a format that takes seconds to read, not minutes to decode. That is the standard a good analytics platform should meet.
If you want to see what modern tools look like in practice, the Scouting4U platform features give a clear picture of how basketball analytics for coaches translates from concept to daily use. The tools are built for working coaches, not analysts with hours to spare on data entry.
Common Mistakes Coaches Make With Analytics
Basketball analytics for coaches is genuinely useful. But it is easy to misuse.
The most common mistake is treating a single metric as the whole story. PER is a useful shortcut, but it does not capture everything. A player can have a high PER and still be a poor fit for your system. Always cross-reference. One number rarely tells the full truth.
Another mistake is using analytics to confirm decisions you have already made. That is motivated reasoning dressed up in data. If you are only looking for numbers that support what you already believe, you will find them - and you will miss the numbers that challenge your assumptions. Good coaching means being willing to be wrong.
Coaches also sometimes over-rely on sample size. A player who shoots 55% from three over seven games is not necessarily a reliable three-point shooter. Small samples produce noisy data. Basketball analytics for coaches requires patience. Trends over 20-plus games are meaningful. Five-game hot streaks often are not.
Finally, do not let analytics replace communication with players. Data can tell you a player is turning the ball over at a high rate. It cannot tell you why he is doing it - whether it is a mechanical issue, a confidence problem, or misunderstanding your offensive system. You still need the conversation. Analytics for coaches is a tool to make those conversations more specific and more useful, not a substitute for them.
Conclusion
Basketball analytics for coaches has changed how the game is prepared for, played, and improved. The coaches seeing the biggest gains are not necessarily the ones with the most data - they are the ones using data most deliberately. Start with the metrics that connect to your real problems. Build the habit of checking data before and after games. Use video to give context to what the numbers show. And use platforms built for working coaches, not research labs.
Basketball analytics for coaches is a skill. Like all skills, it gets sharper with practice. The coaches who start now will have a significant edge over those who wait.
Frequently Asked Questions
What does basketball analytics for coaches actually involve day to day?
In practice, basketball analytics for coaches means reviewing player efficiency data before practice, building opponent scouting reports from tendency analysis, and using lineup performance data to make substitution and rotation decisions. It is not a one-time project - it is an ongoing part of game preparation and player development that becomes faster and more intuitive over time.
Which advanced stats should a coach learn first?
PER, TS%, ORTG, and DRTG are the most immediately useful starting points. PER gives you a quick read on individual player efficiency. TS% tells you how well a player actually scores. ORTG and DRTG tell you how units perform together. Once you are comfortable with those four, usage rate and assist-to-turnover ratio are logical next steps.
Can smaller programs with limited budgets use basketball analytics?
Yes. Basketball analytics for coaches is no longer limited to NBA front offices with full-time analysts. Platforms like Scouting4U are built to be accessible for programs at the high school, college, and semi-professional level. The tools automate the data collection and report generation that used to require dedicated staff. You can check the Scouting4U pricing page to see what options fit your budget.
How does analytics help with recruiting players who fit my system?
Analytics lets you filter prospects by specific performance criteria rather than watching hours of tape on players who may not fit. If your system demands a specific skill set - high assist rate, low turnovers, strong off-ball movement - you can identify candidates who meet those benchmarks before you ever watch a full game. It makes the recruiting process faster and reduces the risk of investing time in the wrong prospects.
Is there a risk of relying too much on data and losing the human element of coaching?
That risk is real if you use analytics poorly. Basketball analytics for coaches works best as a tool that improves your judgment, not one that replaces it. Data tells you what happened and sometimes why. It does not tell you how a player will respond to adversity, how he fits your locker room culture, or whether he has the competitive drive to develop. Those assessments still require human observation and direct interaction. The best approach is to let data sharpen your instincts, not override them.
Enjoyed this article? Share it with others!
Founder & Lead Scout, Scouting4U
2x EuroLeague champion with 30+ years in professional basketball. Daniel won EuroLeague titles with Maccabi Tel Aviv, helped build the staff behind the 2007 European Championship, and has delivered 100+ professional scouting reports across 50+ leagues. If it happened in a European basketball front office, he was probably in the room. He founded Scouting4U in 2010 to bring championship-level scouting intelligence to every club.
No reviews yet. Be the first to share your experience!
Related Articles

Mastering Basketball Service: Scouting Insights & Tools
Key TakeawaysA strong basketball service covers everything from player evaluation to game strategy analysis.Scouting4U g...
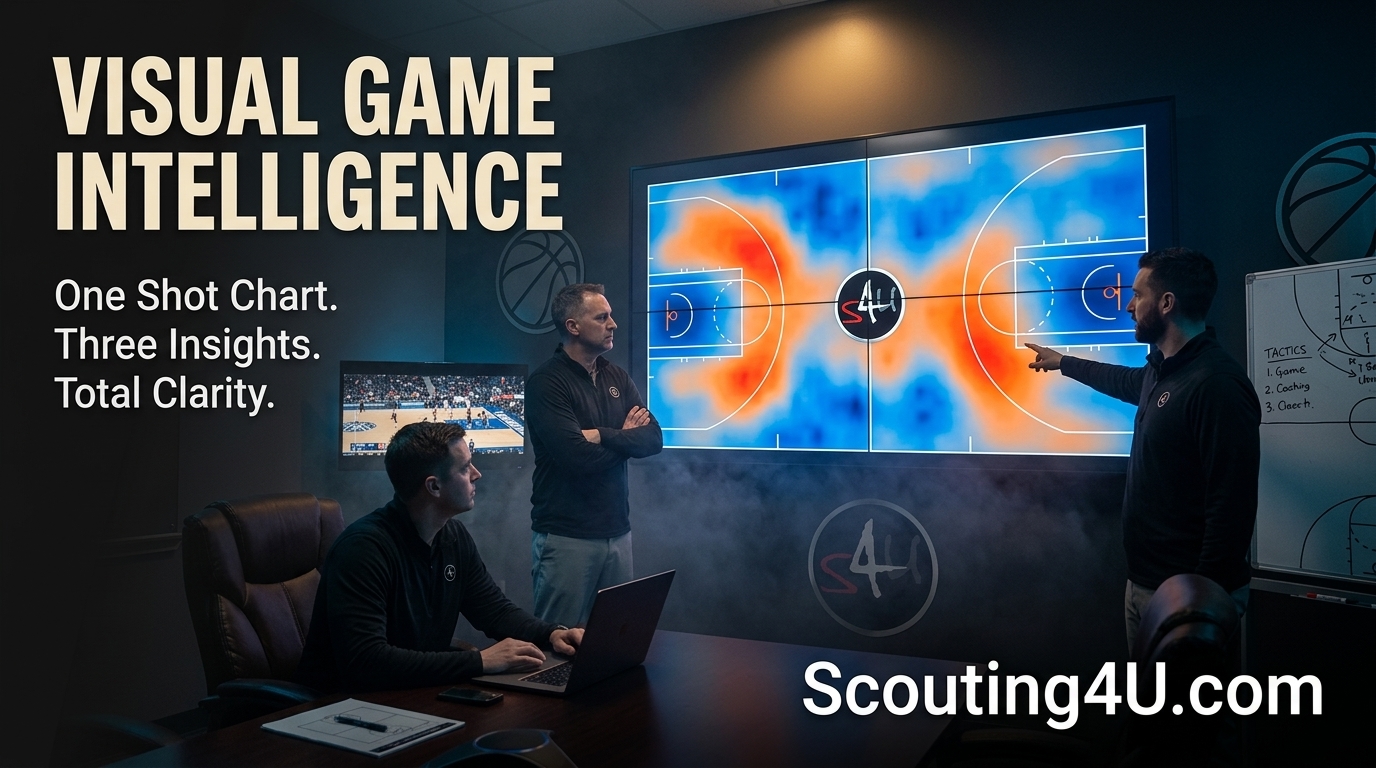
One Shot Chart. Three Insights Visual: Game Plan Revolution
Key TakeawaysA basketball shot chart three insights visual approach reveals high-efficiency zones, player tendencies, an...
How Do Coaches Prepare Scouting Reports?
Basketball Scouting Report Poll Coaches: How Coaches Actually PrepareEvery basketball scouting report poll coaches parti...