
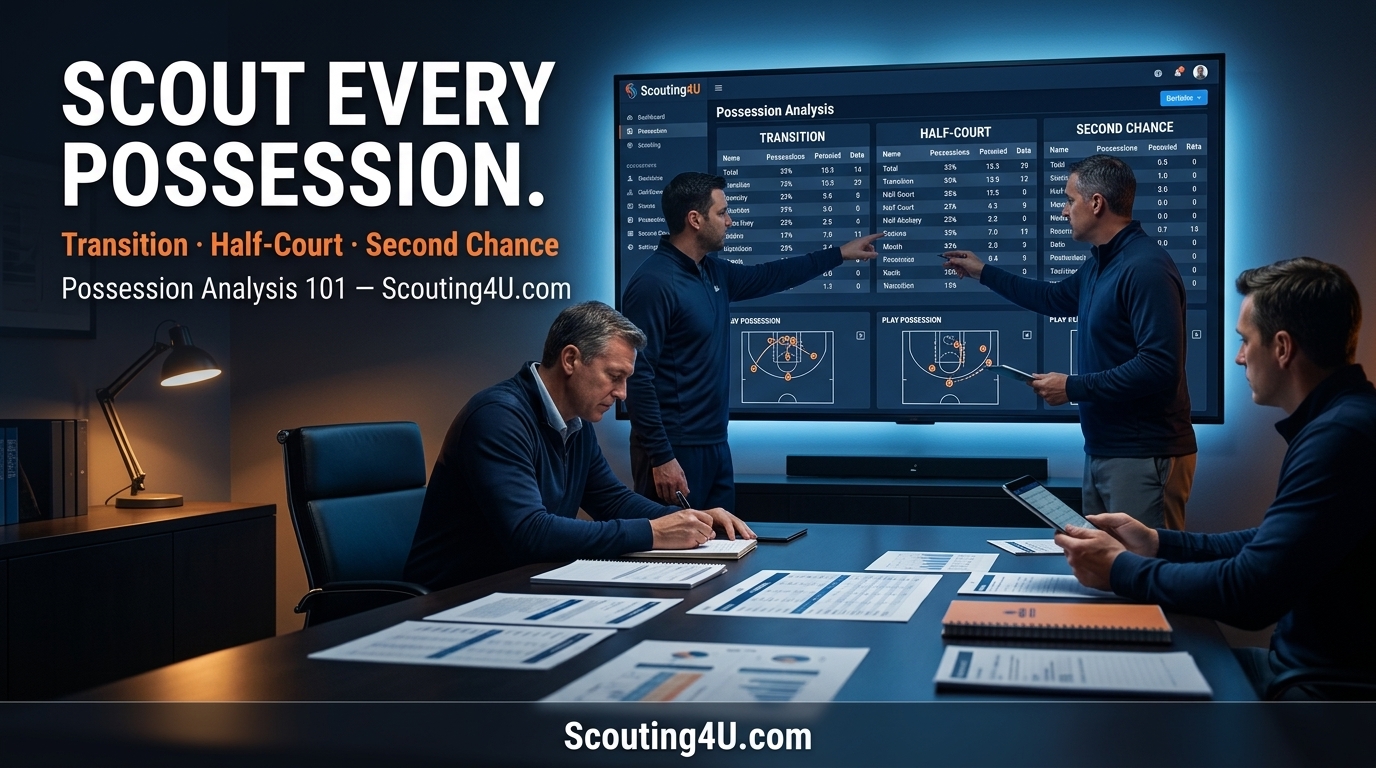
Possession Analysis 101: Transition, Half-Court, Second Chance
Key Takeaways
Basketball possession analysis breakdown divides every offensive sequence into transition, half-court, and second-chance categories.
Transition possessions reward speed and decision-making — disrupting them early is often more effective than chasing the ball handler.
Half-court possessions live or die on player rotation, spacing, and how well you cycle bench players into the flow of the game.
Second-chance points are not random — they follow predictable patterns that show up clearly in shot chart data.
Scouting4U gives coaches and scouts the tools to run a proper basketball possession analysis breakdown without needing a full analytics department.
What Basketball Possession Analysis Breakdown Actually Means
Every basketball game is a sequence of possessions. Win more of them efficiently, and you win more games. That sounds obvious, but most teams track points without asking why those points happened. Basketball possession analysis breakdown changes that. It splits every offensive sequence into a category — transition, half-court, or second-chance — and lets you measure what is working and what is not.
This is not just an NBA-level concern. Coaches at every level can use possession analysis to make sharper decisions. You do not need a full analytics staff. You need a clear framework and the right tools. This guide walks through both.
If you are new to the idea of structured basketball analysis, the article on Mastering Basketball Analytics for Coaches is a good starting point before going deeper here.
Transition Possessions: Speed Is a Strategy
A transition possession begins the moment a team gains the ball — after a defensive rebound, a steal, or a made basket by the opponent. The clock is not the only pressure here. The defense is scrambling. If the offense pushes fast enough, it creates numerical advantages before the defense can set up.
The data on this is consistent. Teams that convert transition opportunities at a high rate tend to score above 1.1 points per possession in those sequences. That is well above the league average for half-court sets. The reason is simple: a four-on-three or a three-on-two gives the offense an inherent structural advantage. The defense cannot cover all the threats at once.
But transition offense is only half the story. Transition defense — stopping your opponent from running — is where basketball possession analysis breakdown gets really useful. When you chart how opponents attack in transition, patterns emerge. Some teams push immediately off any turnover. Others only run off defensive rebounds. Knowing which triggers their run changes how you set up your defensive structure after a score.
Pick-and-roll coverage in transition is a specific problem worth tracking separately. A guard with the ball and a rolling big can punish any defense that is slow to communicate. Studying these sequences on film, tagged by outcome, tells you far more than a box score ever will. The guide on Basketball Game Film Breakdown explains how to build that kind of tagging system efficiently.
When running a basketball possession analysis breakdown on transition, track these things: how many possessions per game start in transition, what percentage end in a shot attempt, and what the points-per-possession average is for those attempts. If the number is below 1.0, the team is likely settling for pull-up jumpers instead of attacking the rim or finding corner threes.
Half-Court Possessions: Where Games Are Actually Won
Transition plays are exciting, but most possessions end up in the half-court. A team that cannot generate good shots with a set defense in front of them will struggle regardless of how well they run. This is where basketball possession analysis breakdown becomes most detailed — and most useful.
Half-court offense is built on spacing, movement, and decision-making within structured plays. The goal is to force the defense to make a choice and then punish the wrong choice. Analyzing this starts with identifying what offensive system the team runs and where the high-value looks are designed to come from.
Usage percentage (USG%) tells you how often a player is involved in a possession ending in a shot, free throw, or turnover. Assist percentage (AST%) tells you how well the team moves the ball to create open looks. Together, they describe how the offense distributes the ball and whether that distribution is efficient.
Offensive rating (ORTG) per 100 possessions is the single best summary stat for half-court efficiency. But it needs context. A team with a high ORTG might be getting there through transition baskets rather than half-court execution. Separating the two categories in your basketball possession analysis breakdown gives you a more honest picture.
Rotation management also matters here. Starters and bench players often operate differently within the same offensive system. A starting point guard who thrives running pick-and-roll might be replaced by a bench player who functions better as a spot-up shooter. If you are not tracking how possession quality shifts when lineups change, you are missing a major part of the story. The Advanced Basketball Statistics guide covers lineup metrics in detail.
One practical approach: tag every half-court possession by play type — isolation, pick-and-roll ball handler, pick-and-roll roll man, post-up, spot-up, off-screen, hand-off, or cut. Then calculate points per possession for each type. Most teams will find two or three play types that generate most of their good looks, and two or three that consistently lead to poor shots or turnovers. That alone can reshape a game plan.
Second-Chance Possessions: The Points Teams Leave Behind
Second-chance possessions come from offensive rebounds. They are often treated as bonus plays, almost accidental. But teams that attack the offensive glass deliberately generate a measurable scoring advantage over a full season.
The math is straightforward. A missed shot that is recovered by the offense gives that team another possession. Over a 40-minute game, a team that grabs three or four extra offensive rebounds — rather than retreating for transition defense — can add four to eight extra points. In close games, that margin is often decisive.
Not all second-chance opportunities are equal. Shot location at the time of the miss affects where the rebound goes. Long two-point attempts typically produce long rebounds that bounce out beyond the arc. Short shots from the paint rebound closer to the basket, where offensive players are more likely to be positioned. A proper basketball possession analysis breakdown uses shot chart data to map where second-chance points are coming from and which shot types are producing them.
Scouting4U's shot chart tools make this kind of analysis practical. You can see not just where shots are taken, but where offensive rebounds are retrieved and what shots follow. For a closer look at how shot location data works, the article on Basketball Shot Chart Analysis: Transform Data into Insights explains the full methodology.
Defensively, second-chance prevention is about box-out discipline and rebounding assignments. When you run a basketball possession analysis breakdown on an opponent, look at their offensive rebounding rate by player. Some teams have one designated offensive rebounder — a big who always crashes. Others have guards who sneak in from the weak side. Knowing which players to box out first changes your team's defensive rebounding assignments.
Key Metrics That Drive Possession Analysis
Numbers without context are noise. Here are the metrics that matter most in a basketball possession analysis breakdown, and what they actually tell you.
Points per possession (PPP): The cleanest measure of offensive efficiency. Calculate it by dividing total points by total possessions. Anything above 1.1 is strong. Below 1.0 suggests structural problems in shot selection or execution.
Effective field goal percentage (eFG%): Adjusts for the fact that three-point makes are worth more. A team shooting 48% from the field but taking mostly twos is often less efficient than a team shooting 43% while attacking threes and rim attempts.
Turnover percentage (TOV%): Measures turnovers per 100 possessions. High turnover teams give opponents extra possessions without even taking a shot. This directly inflates opponent PPP.
Offensive rebounding percentage (OREB%): What share of available offensive rebounds does a team collect? This drives second-chance volume directly.
Free throw rate (FTR): Free throws are the most efficient way to score. Teams that draw fouls consistently maintain efficiency even through cold shooting stretches.
Player Efficiency Rating (PER) and True Shooting Percentage (TS%) round out the picture at the individual level. TS% in particular is worth understanding in depth — the article on True Shooting Percentage Basketball: Calculation and Insights breaks it down clearly.
Using Scouting4U for Possession Analysis
Running a basketball possession analysis breakdown manually is possible. It is also slow, especially if you are tagging film, building spreadsheets, and trying to prepare for a game on a short turnaround. Scouting4U was built to compress that process.
The platform lets coaches and scouts organize film, tag possession types, track metrics by lineup, and generate reports without needing a data science background. Daniel Gutt built Scouting4U out of his experience in European basketball, where detailed scouting reports were essential but the tools to create them efficiently were limited. That gap is what the platform addresses.
For scouts working on recruitment, possession analysis data feeds directly into player evaluation. A player who produces efficiently in half-court sets translates differently than one who only performs in transition. Understanding the context behind the numbers makes the evaluation sharper. The article on How Data Analytics Transforms Basketball Recruitment covers this connection in detail.
Coaches preparing for specific opponents can use the platform to run a targeted basketball possession analysis breakdown on that team — identifying transition triggers, half-court tendencies, and offensive rebounding habits — in a fraction of the time it would take with raw film alone.
Building a Possession Analysis Routine
The best basketball possession analysis breakdown is one you can actually run consistently, not just before big games. Here is a practical weekly routine that works at most levels of play.
After each game, tag every possession by type: transition, half-court, or second-chance. Note the outcome — score, turnover, or non-scoring foul. Calculate PPP for each category. Compare against your season averages and the opponent's averages.
Before each game, pull the same data on the upcoming opponent. Identify their strongest possession category and their weakest. Plan to force them into their weak category as often as possible. If they thrive in transition but struggle in half-court sets, slow the pace. If they rarely crash the offensive glass, your guards can safely sprint back on defense.
Review your own team's numbers at least once a week. Look for trends across five-game windows rather than reacting to single-game outliers. Possession efficiency fluctuates game to game, but the trends over a stretch of games reveal genuine strengths and weaknesses.
This kind of routine is exactly what separates analytically-driven programs from those still relying purely on intuition. Basketball possession analysis breakdown done consistently creates a compounding advantage over a season.
Conclusion
Basketball possession analysis breakdown is not a luxury for teams with big analytics budgets. It is a practical framework any coach or scout can apply with the right approach and tools. Transition possessions reward speed and preparation. Half-court possessions reward structure and smart rotation. Second-chance possessions reward effort and positioning. Each category tells a different part of the story, and together they explain why teams win and lose far more accurately than final scores alone.
The teams that track possession quality consistently, adjust based on what the data shows, and build game plans around specific possession tendencies will make better decisions throughout a season. That is not a vague prediction — it is what the evidence from every level of the sport shows. Start with the framework in this guide, use the metrics that matter, and run your basketball possession analysis breakdown as a regular part of game preparation rather than an occasional project.
Frequently Asked Questions
What is a basketball possession analysis breakdown?
A basketball possession analysis breakdown is the process of categorizing every offensive sequence into transition, half-court, or second-chance plays and measuring the efficiency of each. It helps coaches and scouts understand where a team is scoring well, where possessions are being wasted, and how to exploit opponent weaknesses.
How many possessions does a typical basketball game have?
A typical NBA game has roughly 95 to 100 possessions per team. College games tend to fall between 65 and 75 possessions, depending on pace of play. Knowing your team's possession count per game is the starting point for any basketball possession analysis breakdown, since all efficiency metrics are calculated per possession.
Which possession type generates the most points per possession?
Transition possessions generally produce the highest points-per-possession numbers, often above 1.1 to 1.2 in well-run offenses. That is because the defense has not yet set up, creating numerical advantages and open shots. Half-court possessions typically average closer to 0.9 to 1.05 PPP, and second-chance possessions vary widely based on shot location and offensive rebounding talent.
How does possession analysis help with scouting opponents?
When you run a basketball possession analysis breakdown on an upcoming opponent, you can identify their transition triggers, their preferred half-court play types, and their offensive rebounding habits. That information directly shapes your defensive game plan — whether to push or slow the pace, which players to box out, and which ball handlers to pressure before they can initiate their sets.
Can smaller programs with limited staff use possession analysis effectively?
Yes. You do not need a full analytics team to run useful possession analysis. Start by tagging possessions in your own game film into three categories and calculating points per possession for each. Platforms like Scouting4U are specifically designed to make this process manageable for coaches without dedicated data staff. Even a basic basketball possession analysis breakdown done consistently will produce actionable insights within a few weeks of tracking.
Enjoyed this article? Share it with others!
Founder & Lead Scout, Scouting4U
2x EuroLeague champion with 30+ years in professional basketball. Daniel won EuroLeague titles with Maccabi Tel Aviv, helped build the staff behind the 2007 European Championship, and has delivered 100+ professional scouting reports across 50+ leagues. If it happened in a European basketball front office, he was probably in the room. He founded Scouting4U in 2010 to bring championship-level scouting intelligence to every club.
No reviews yet. Be the first to share your experience!
Related Articles
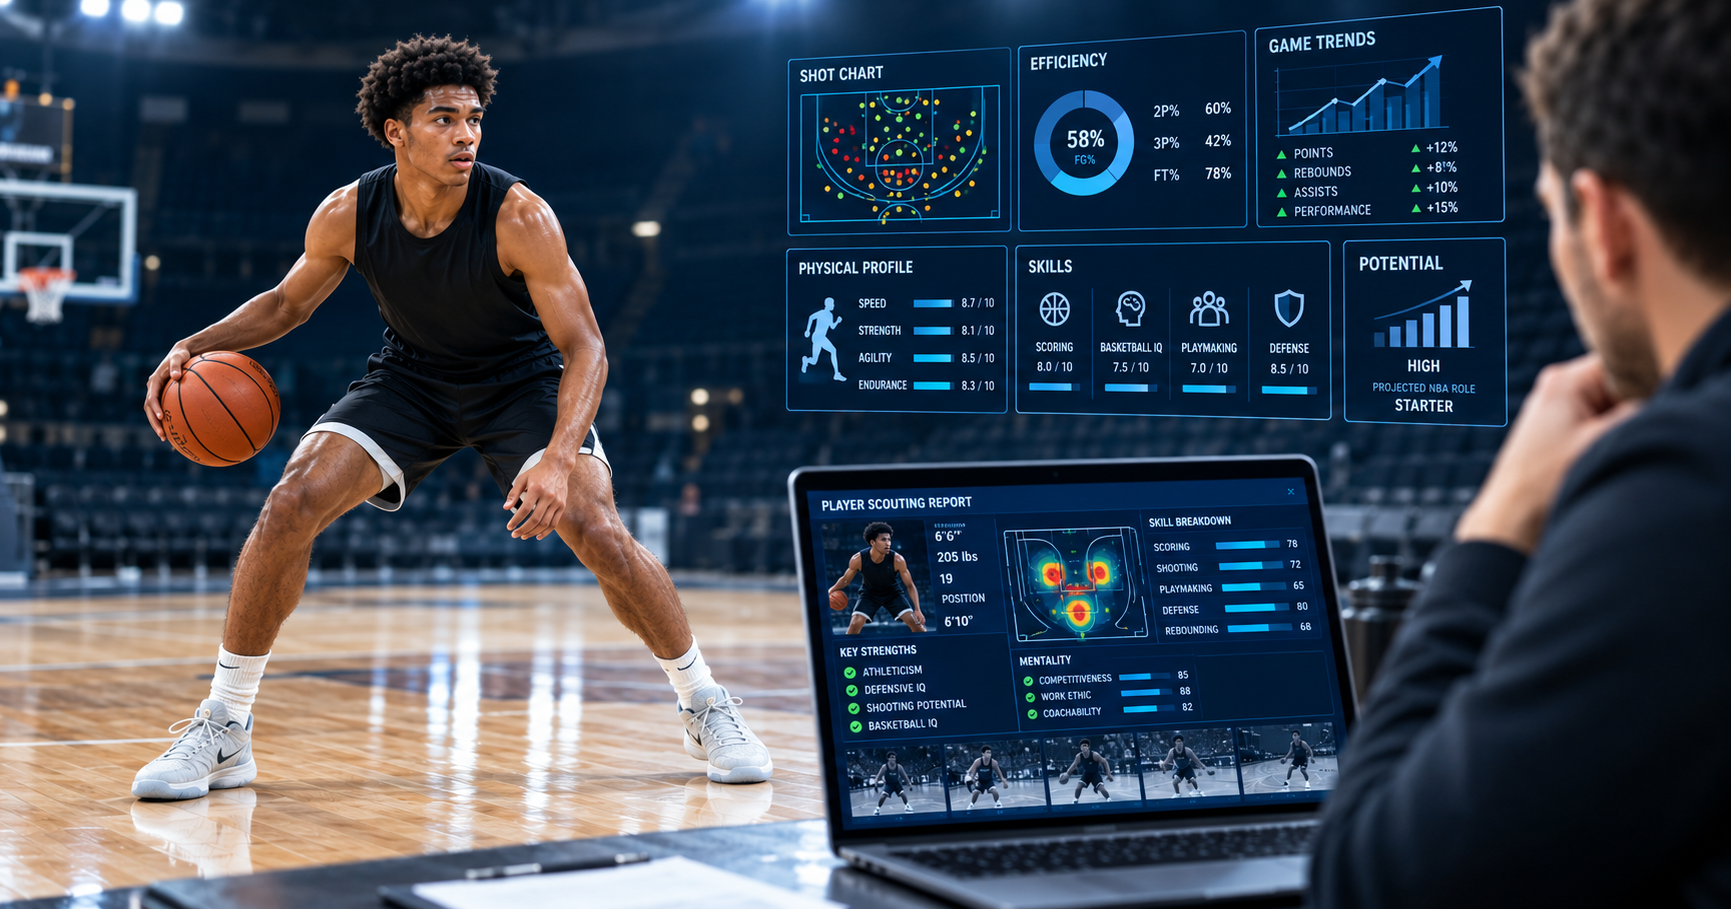
Analyzing Basketball Player Potential: Scouting Insights
Key Takeaways Analyzing basketball player potential combines data analysis with scouting intuition. Core metrics includ...

Mastering Basketball Service: Scouting Insights & Tools
Key TakeawaysA strong basketball service covers everything from player evaluation to game strategy analysis.Scouting4U g...
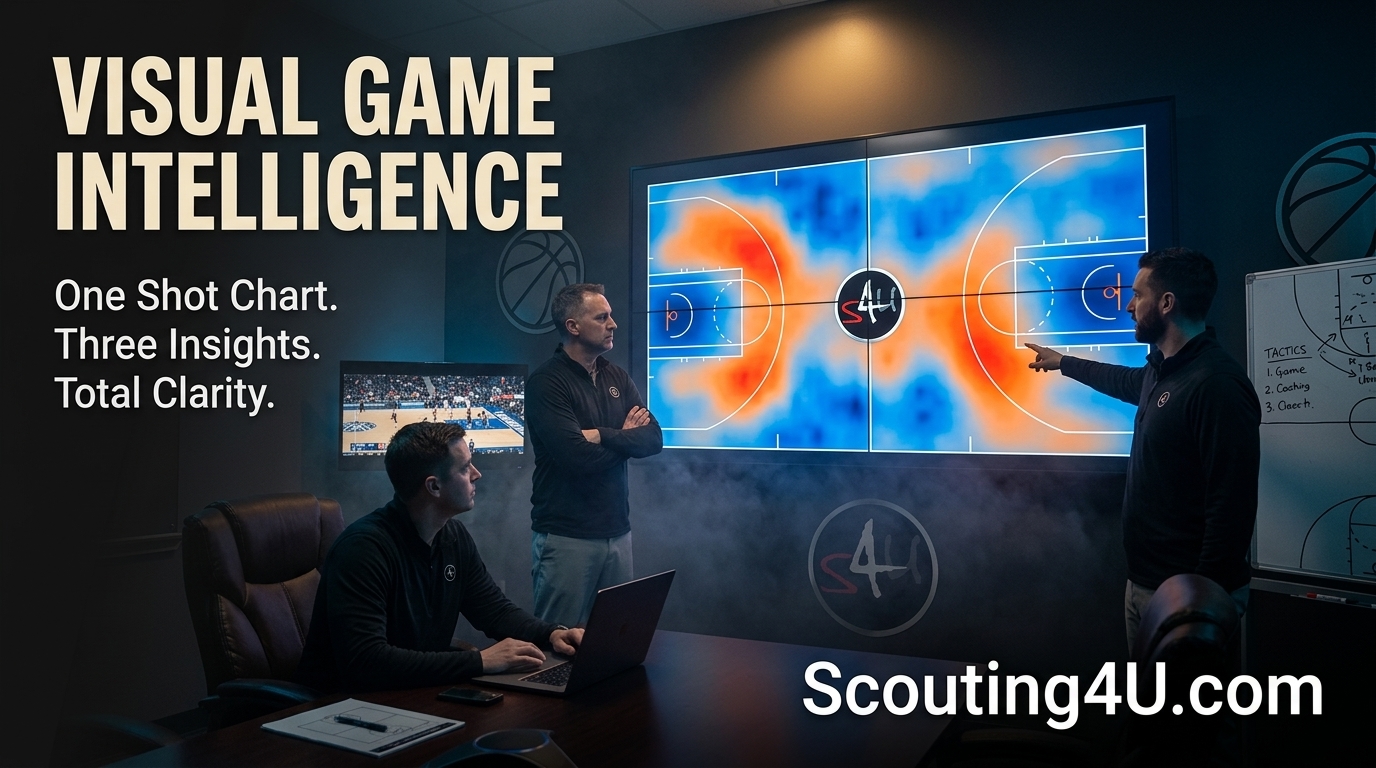
One Shot Chart. Three Insights Visual: Game Plan Revolution
Key TakeawaysA basketball shot chart three insights visual approach reveals high-efficiency zones, player tendencies, an...