Reading Shot Charts Like a Pro: Zone Analysis
Key Takeaways
Basketball shot chart analysis zones give coaches a clearer picture of where players score - and where they struggle.
Zone analysis exposes opponent shooting tendencies so your defense can force inefficient shots.
Pairing shot zone data with metrics like True Shooting Percentage sharpens your game planning.
Scouting4U's platform makes basketball shot chart analysis zones accessible for teams at every level.
Rotation decisions improve when you know which players thrive in which court areas.
Introduction to Basketball Shot Chart Analysis Zones
Basketball shot chart analysis zones are one of the most practical tools a coach can use. They take the full court and break it into distinct areas - the paint, the mid-range, the corners, the wings, and beyond the arc. Each zone tells a story. Not just how often a player shoots there, but how efficiently they score, what shot types they prefer, and whether they are a real threat or just taking up space on the floor.
This guide walks through what basketball shot chart analysis zones actually look like, how to read them, and how to turn that data into decisions that affect real games. Whether you coach at the youth level or scout professionally, this framework applies.
Why Basketball Shot Chart Analysis Zones Change How You See the Game
A raw shooting percentage tells you very little. A player who shoots 45% overall might be 55% in the paint and 28% from the mid-range. Without zone data, you treat those shots as equal. They are not.
Basketball shot chart analysis zones force you to stop averaging and start thinking spatially. Where does this player actually create? Where do they take shots they should not? Which zones does your opponent exploit on offense, and which ones do they give away on defense?
These questions matter on both ends of the floor. On offense, zone data helps you design plays that put shooters in their best spots. On defense, it tells you where to send ball-handlers, where to help, and where you can afford to give space. If you want to go deeper on the defensive side, our article on Possession Analysis 101: Transition, Half-Court, Second Chance pairs well with shot zone work.
The Standard Court Zones You Need to Know
Most basketball analytics platforms divide the court into somewhere between 5 and 14 zones depending on how granular you want to get. Here are the core areas and what they mean in practice.
The Paint and Restricted Area
The restricted area is the small semicircle directly under the basket. Shots here are the most efficient in basketball - typically finishing at 60% or higher across all levels. The broader paint extends to the free throw line. Players who get to the paint frequently are high-value offensive weapons. Defending the paint without fouling is one of the hardest problems in the sport.
When you look at basketball shot chart analysis zones, the paint is always your starting point. If a team dominates this zone, they win most games. If they are being held to perimeter jumpers, their offense is in trouble.
The Mid-Range Zone
The mid-range gets a bad reputation in modern basketball, and the criticism has statistical support. Shots from 10-20 feet count two points, just like layups, but go in far less often. The average mid-range attempt converts around 40-43% at the NBA level - much lower than paint shots and only marginally better than many three-point attempts when you account for point value.
That said, mid-range shooting is not dead. Players who shoot 48%+ from this zone, like elite mid-range specialists, are genuinely difficult to defend. Basketball shot chart analysis zones help you identify whether a player is a true mid-range threat or just settling for difficult twos.
Corner Threes
The corner three is the shortest three-point attempt on the court. Most players shoot it at a higher percentage than above-the-break threes. If your shot chart shows a player or team scoring well from the corners, you need a defensive plan to take that away. Leaving corner shooters open is one of the most common defensive mistakes in the game.
Above-the-Break Threes
This zone covers the arc from wing to wing, excluding the corners. It is a larger area, which means there is more variance in shot quality. A pull-up three off a ball screen is very different from a catch-and-shoot three on a kick-out. Basketball shot chart analysis zones can tell you that a player scores well above the break, but video review tells you whether that is sustainable.
The Elbow and High Post
The two elbows - where the free throw line meets the lane lines - are transition spots. Plays often funnel through here on drive-and-kick actions or in half-court sets. A player who is a threat from one or both elbows creates real decision-making problems for defenders. Tracking these zones separately from the broader mid-range area gives you more precise information.
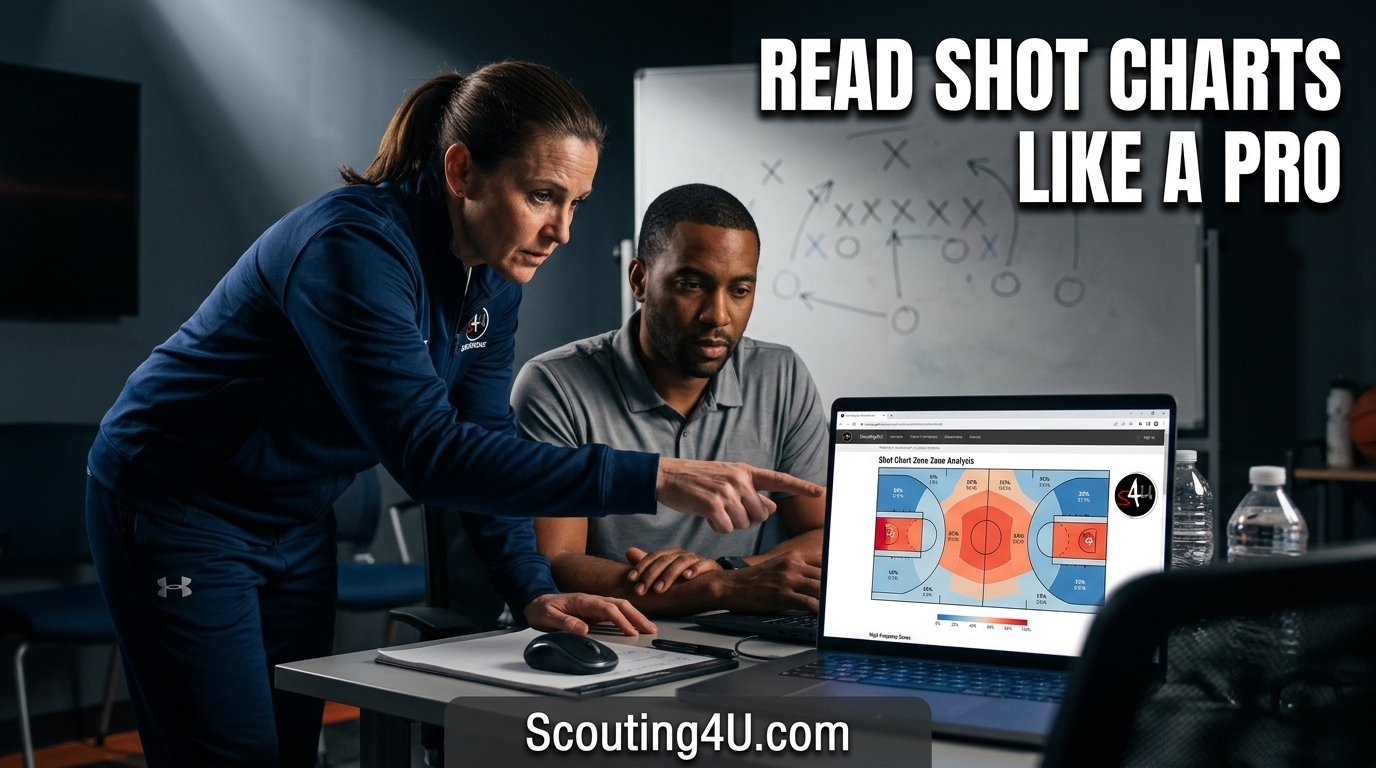
How to Read a Shot Chart Without Getting Confused
Shot charts use color coding and bubble sizes to show frequency and efficiency at once. Larger bubbles mean more attempts. Warmer colors - red or orange - mean better-than-average efficiency. Cooler colors - blue or gray - mean below-average shooting.
Here is a simple way to read any basketball shot chart analysis zones display:
Find the biggest bubbles first. That is where the player shoots most often.
Check the color. A big red bubble in the paint is good for the offense. A big blue bubble in the mid-range is a defensive gift.
Look for cold zones your opponent avoids. Those are areas where your defense can concede space.
Look for hot zones your opponent exploits. Those need your best defender or a coverage adjustment.
Once you get comfortable with this framework, basketball shot chart analysis zones become fast to interpret. You can sit down before a game, review five or six charts, and walk into your film session with clear priorities. For a detailed walkthrough of building that process, see our guide on How to Analyze Basketball Shot Charts Effectively.
Using Zone Data to Build Your Game Plan
Shot charts are only useful if they change what you do on the floor. Here is how to connect basketball shot chart analysis zones to actual decisions.
Offensive Game Planning
Start with your own players' zone data. Which players shoot above league average from the corners? Run sets that move the ball there for them. Which players are a threat from the elbow? Design actions that free them at that spot. If your best player is ice-cold from the mid-range but excellent in the paint, your plays should get him downhill, not create pull-up opportunities at 17 feet.
This sounds obvious, but many coaches design plays based on habit or what they ran at their previous job. Zone data makes you honest about what your roster actually does well.
Defensive Game Planning
On defense, basketball shot chart analysis zones tell you where to send opponents. If a ball-handler is a poor corner shooter but a good above-the-break shooter, funnel him toward the corner. If a big man is dangerous from the elbow, your drop coverage might need adjustment.
Pick-and-roll defense in particular depends on zone awareness. How deep you drop, whether you switch, or whether you hedge all depend on the offensive player's zone tendencies. A guard who cannot shoot above the break can be smothered by a deep drop. A guard who shoots 42% from above the break needs tighter coverage. For more on this topic, our article on Mastering Basketball Analytics for Coaches breaks down how to connect zone data to specific defensive schemes.
Zone Analysis and Player Rotation Decisions
Basketball shot chart analysis zones also affect who you play and when. If you need a shooting threat from the corners in the fourth quarter, your zone data tells you who that player is. If you are protecting a lead and need someone who can defend the paint without fouling, zone data on your opponent's interior scorers helps you decide your defensive lineup.
Coaches who make rotation decisions on feel alone are leaving information on the table. Zone data does not replace intuition, but it checks it. You might believe a player is a corner shooter. The data might say otherwise. Both pieces of information matter.
For a fuller look at how to structure your lineup decisions around data, read our breakdown of Optimize Your Basketball Rotation: Starters vs Bench.
Key Metrics That Work Alongside Zone Data
Basketball shot chart analysis zones work best when you combine them with supporting metrics. Here are the ones that matter most.
True Shooting Percentage (TS%) adjusts for the extra value of three-pointers and free throws. It is a better measure of scoring efficiency than raw field goal percentage. When you look at a zone chart, TS% gives you context for whether a high-frequency zone is actually producing value.
Shot frequency by zone shows how often a player or team goes to each area. A player might be efficient in a zone but rarely go there. That matters for how much defensive attention you allocate.
Effective Field Goal Percentage (eFG%) weights three-pointers at 1.5x their field goal attempt value. Comparing eFG% across zones helps you see which zones produce the most real scoring.
Points Per Shot (PPS) is the most direct metric. Divide total points scored in a zone by total shot attempts. A zone that produces 1.2 PPS is more valuable than one producing 0.8 PPS, regardless of raw percentage.
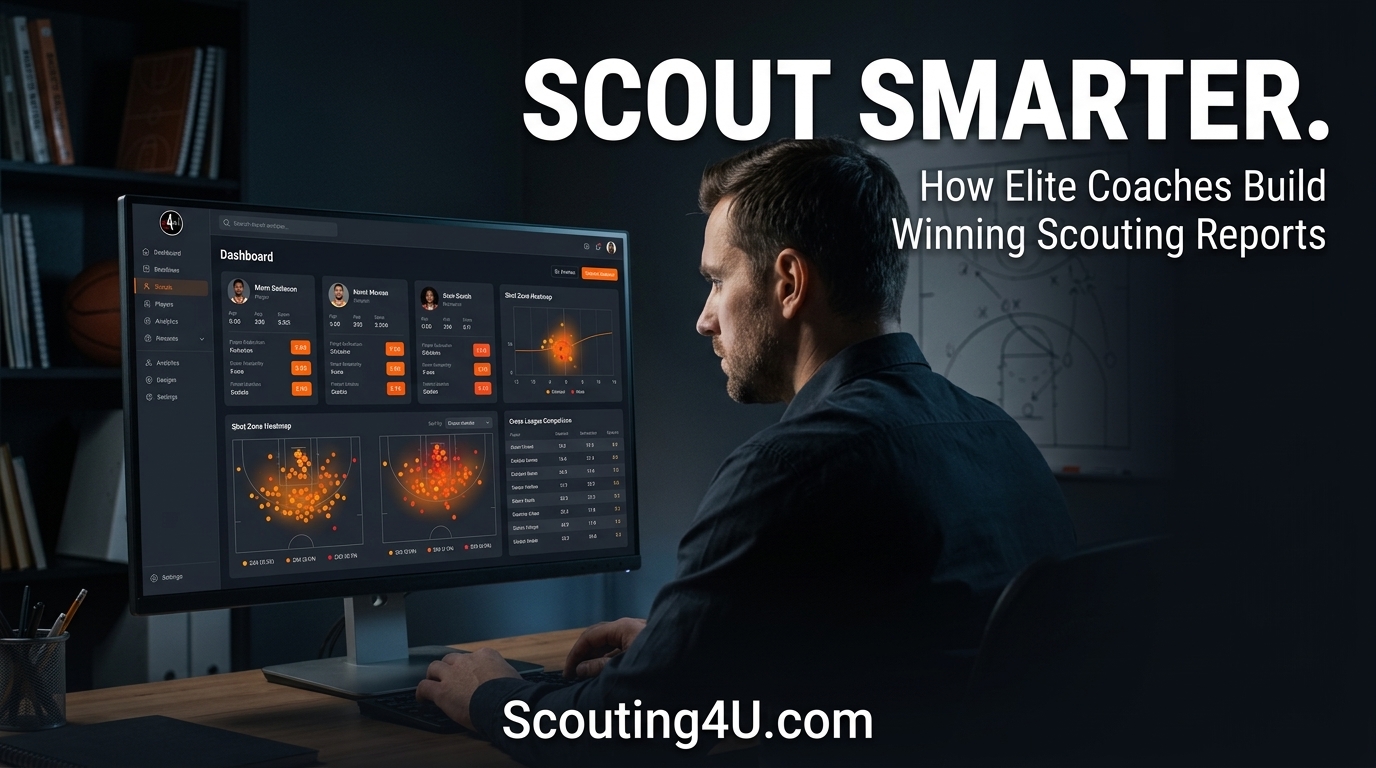
How Scouting4U Supports Basketball Shot Chart Analysis Zones
Scouting4U was built by EuroLeague analyst Daniel Gutt to give coaches at every level access to the kind of data previously reserved for professional staff. The platform pulls game data, maps shots to court zones automatically, and displays the results in charts that are easy to read and export.
For coaches who do not have time to build spreadsheets manually, this matters. You can pull up basketball shot chart analysis zones for an upcoming opponent in a few minutes rather than a few hours. That speed changes how you prepare - you can look at more opponents, more players, and more matchup-specific questions within the same preparation window.
The platform also connects zone data to video, so you can click on a zone and pull up the actual clips from those attempts. That combination of data and film is where real scouting happens. Check the Scouting4U platform features page to see exactly what the tools include, or visit the subscription plans and pricing page to find an option that fits your budget.
Common Mistakes When Reading Shot Charts
Zone analysis is not foolproof. Here are the errors coaches make most often.
Small sample sizes. A player who is 4-for-5 from the corner in two games is not necessarily a 80% corner shooter. Treat small samples with skepticism. Look for patterns across at least 10-15 attempts before drawing strong conclusions.
Ignoring shot quality within zones. Two players can both shoot from the right wing, but one is catching open threes and the other is pulling up off dribble pressure. Same zone, very different shot quality. Video fills in what data cannot show.
Treating zone data as fixed. Players change. A shooter who was cold from the corners last season may have worked on it. A big man who was a mid-range threat may have lost that shot. Prioritize recent data over historical averages.
Only looking at offense. Defensive zone coverage matters too. Where does your team give up the most efficient looks? Basketball shot chart analysis zones should inform your defensive schemes just as much as your offensive ones.
Conclusion
Basketball shot chart analysis zones are not a luxury reserved for NBA teams with full analytics departments. They are a practical tool for any coach who wants to make better decisions - about offense, defense, and personnel. The framework is not complicated once you understand the zones and how to read efficiency data within them. The challenge is building the habit of using this information consistently, game to game, rather than only when a problem is obvious.
Start with your own players. Map their zones. Find where they are genuinely efficient and where they waste possessions. Then apply the same lens to opponents. Over time, basketball shot chart analysis zones will change how you see the game - not just on paper, but in real time during games, when you recognize a matchup to exploit or a coverage to adjust.
Frequently Asked Questions
What are basketball shot chart analysis zones?
Basketball shot chart analysis zones divide the court into distinct areas - such as the paint, mid-range, corners, wings, and above the arc - so coaches can evaluate shooting efficiency and frequency by location rather than treating all shots as equal.
How many zones does a standard shot chart use?
It depends on the platform and how detailed you want to get. Basic shot charts use 5-7 zones. More advanced systems use 13-14 zones and can break down left vs. right side, specific elbow areas, and shot type within each zone.
How do basketball shot chart analysis zones help with defense?
Zone data shows you where opponents score efficiently and where they struggle. You can use this to design coverage that funnels ball-handlers into their cold zones and denies them access to their hot ones. Pick-and-roll coverages, for example, change significantly depending on whether a ball-handler is a threat from above the break.
Can coaches at amateur or youth levels use shot chart analysis?
Yes. The concepts are the same regardless of level. Platforms like Scouting4U make it practical for coaches who do not have large staff by automating the data collection and chart generation process. The analysis itself is straightforward once you understand what the zones mean.
What metrics should I combine with basketball shot chart analysis zones?
True Shooting Percentage, Effective Field Goal Percentage, and Points Per Shot are the most useful companions to zone data. They translate raw shooting numbers into actual scoring value, which is what matters when you are deciding where to defend or where to create shots on offense.
Enjoyed this article? Share it with others!
Founder & Lead Scout, Scouting4U
2x EuroLeague champion with 30+ years in professional basketball. Daniel won EuroLeague titles with Maccabi Tel Aviv, helped build the staff behind the 2007 European Championship, and has delivered 100+ professional scouting reports across 50+ leagues. If it happened in a European basketball front office, he was probably in the room. He founded Scouting4U in 2010 to bring championship-level scouting intelligence to every club.
No reviews yet. Be the first to share your experience!
Related Articles

Mastering Basketball Service: Scouting Insights & Tools
Key TakeawaysA strong basketball service covers everything from player evaluation to game strategy analysis.Scouting4U g...
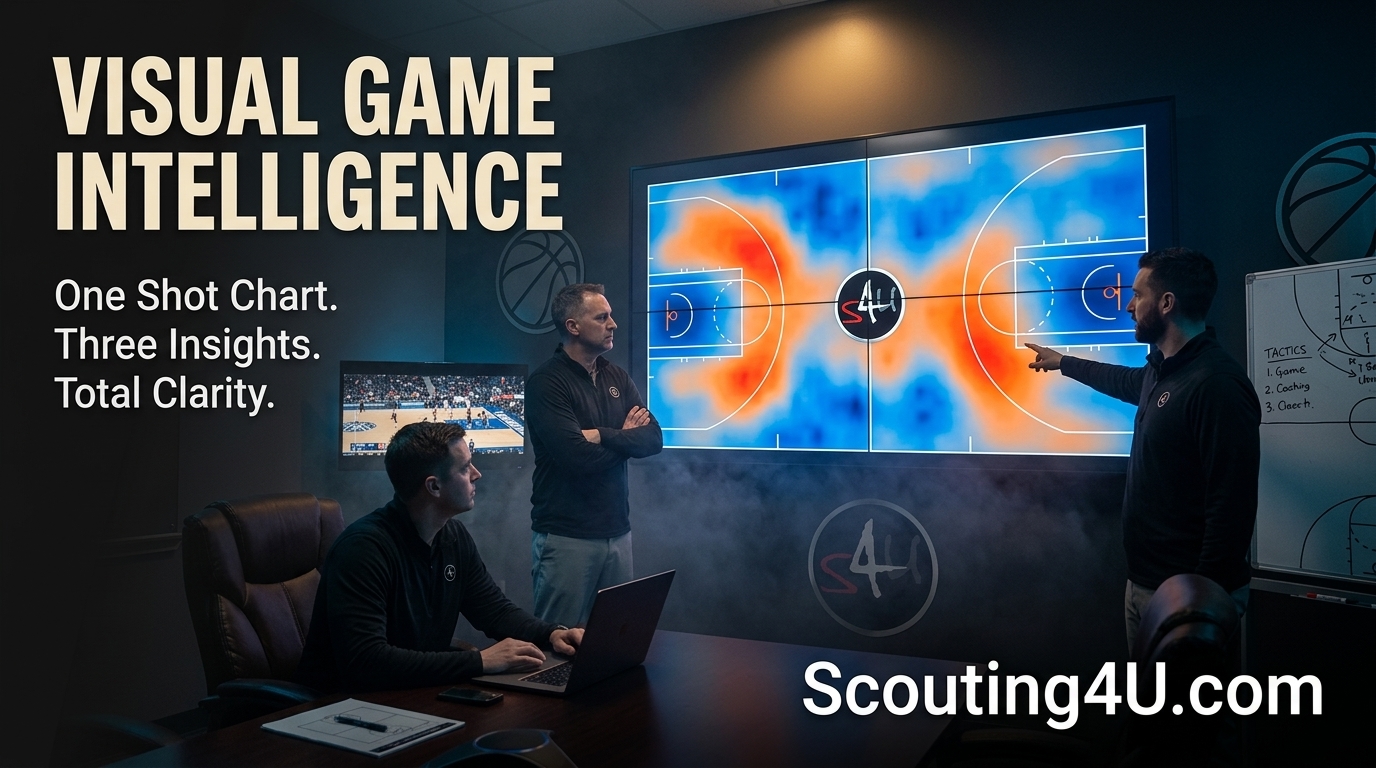
One Shot Chart. Three Insights Visual: Game Plan Revolution
Key TakeawaysA basketball shot chart three insights visual approach reveals high-efficiency zones, player tendencies, an...
How Do Coaches Prepare Scouting Reports?
Basketball Scouting Report Poll Coaches: How Coaches Actually PrepareEvery basketball scouting report poll coaches parti...