Scouting Tip: Filter Stats by Game Result for Winning Insights
Key Takeaways
The scouting tip filter stats by game result reveals how teams behave differently when winning versus losing.
Opponents under pressure often expose tactical vulnerabilities you can exploit.
Pick-and-roll defense adjustments shift noticeably when teams trail - tracking this gives you an edge.
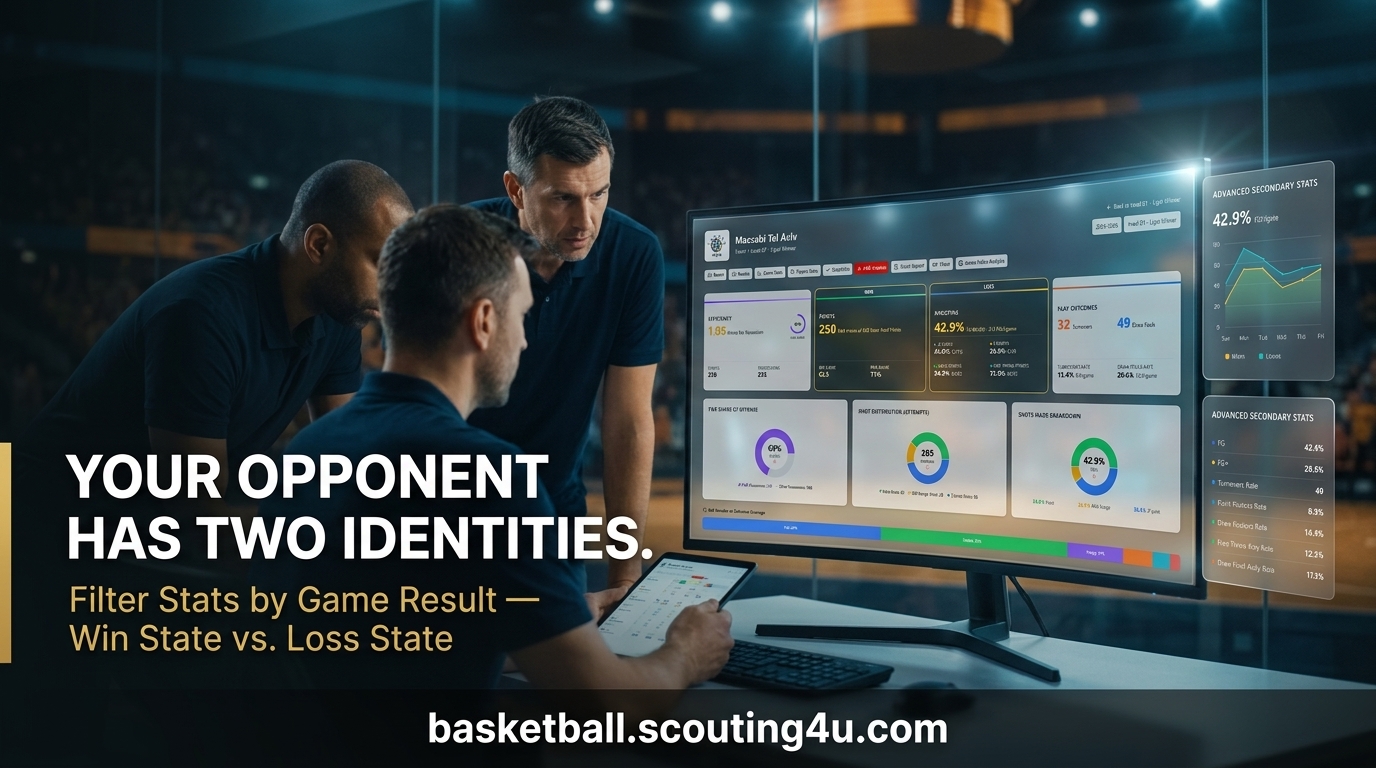
Scouting4U makes it easy to apply the scouting tip filter stats by game result across full seasons.
Contextual stat filtering separates good scouts from great ones.
Why the Scouting Tip Filter Stats by Game Result Changes Everything
Most coaches look at season averages. That's a mistake. A team averaging 38% from three looks very different when they're down 10 in the fourth quarter compared to when they're up by 15. The scouting tip filter stats by game result forces you to stop treating all possessions as equal - because they aren't.
When you split data by game result, patterns emerge that raw averages hide completely. Does your opponent increase pick-and-roll usage when trailing? Do they abandon the paint and go perimeter-heavy? Does their defensive scheme collapse under pressure? These are the questions that win games, and you can't answer them without first applying the scouting tip filter stats by game result to your dataset.
This approach is used at the highest levels of professional basketball. EuroLeague analysts, NBA front offices, and top college programs all segment their scouting data by game state. If you're not doing it, you're preparing with incomplete information.
How to Apply the Scouting Tip Filter Stats by Game Result
The process is straightforward once you have the right tools. Start by pulling your opponent's game log for the last 15-20 games. Then separate those games into two buckets: wins and losses. Apply the scouting tip filter stats by game result to each bucket independently.
Look at these categories for each bucket:
Three-point attempt rate
Paint scoring percentage
Pace and possessions per game
Free throw rate
Bench minutes and rotation depth
Turnover rate under pressure
The gaps between the two buckets tell you what that team does when their back is against the wall. That's the intel you actually need going into a game. For a deeper breakdown of which numbers matter most at each level, the guide on 7 basketball stats players should track for success is worth reading before you start filtering.
Once you've run the basic split, take it one step further. Look at how those gaps shift across the season - not just overall. A team that handled pressure well in November may crack in March when fatigue and standings pressure combine. The scouting tip filter stats by game result becomes more accurate the more you narrow the time window to recent form.
Analyzing Opponent Behavior When They're Losing
Teams change when they're losing. Some coaches go conservative and try to grind back into games. Others panic and start gambling on defense. Knowing which type you're facing changes your entire game plan.
Apply the scouting tip filter stats by game result specifically to losing-game data and watch for these signals:
Increased three-point volume. Many teams shift to perimeter shooting when down late. If you see that tendency in the filtered data, your defense can anticipate it and deny those spots.
Rotation changes. Coaches often shorten or lengthen their bench rotation mid-game when losing. Filtered stats reveal these patterns before you step on the floor. For more on reading rotation patterns, check out the post on basketball starters bench rotation data tip: optimize strategy.
Defensive scheme shifts. Some teams switch to full-court pressure when trailing. Others drop into zone. The scouting tip filter stats by game result will show you which adjustment your opponent makes most often - and how effective it actually is for them.
Star player usage spikes. When losing, many teams funnel the ball to their best player at a higher rate. Knowing this lets you game-plan defensive resources accordingly.
It's also worth flagging which losses came at home versus on the road. Road losses often produce more conservative shot selection and tighter rotation decisions. Home losses tend to push coaches toward more aggressive adjustments - faster pace, more gambling on defense. The scouting tip filter stats by game result gives you the raw numbers; the venue context tells you why.
Pick-and-Roll Defense Adjustments Under Pressure
Pick-and-roll defense is where most scouting reports get it wrong. They describe what a team does in an average game. The scouting tip filter stats by game result shows you what they do when it actually matters.
Teams trailing by 5-10 points in the second half often change their pick-and-roll coverage. A team that hedges hard early in a comfortable game may switch to drop coverage when energy is depleted. A team that normally switches everything may revert to zone principles when tired or foul-compromised.
When you apply the scouting tip filter stats by game result to pick-and-roll data specifically, you'll spot the gaps. Maybe their ball handler gives up the middle when pressing. Maybe their big man cheats off the roller when scrambling back. These are coachable targets that only appear in the "losing" data bucket.
For a full framework on analyzing these coverages, the article on how to analyze pick-and-roll defense coverage lays out the methodology clearly.
How Scouting4U Makes This Filter Practical
Manually splitting game logs into wins and losses, then recalculating every stat, takes hours. Scouting4U automates this. The platform lets you apply the scouting tip filter stats by game result in a few clicks - across full seasons, specific date ranges, or even single opponents.
Their shot chart tools show you where teams shoot from in wins versus losses. The possession breakdown view segments play-type data by game outcome. You get the filtered numbers instantly, without building spreadsheets by hand.
The scouting tip filter stats by game result only works if you have clean, comprehensive data to filter. That's where a purpose-built platform beats a manual workflow every time. You can explore the full toolkit at Scouting4U platform features and tools.
If you're comparing analytics platforms before committing, the breakdown at best basketball analytics software 2026: complete guide gives you an honest look at what each tool actually offers.
European Basketball Has Used This for Years
European scouting culture has been ahead of this curve for a long time. EuroLeague analysts have built contextual filtering into their workflows because the competition requires it. Playoff berths in the EuroLeague come down to thin margins, and knowing how an opponent responds to pressure is the difference between a good game plan and a great one.
The scouting tip filter stats by game result is especially useful when preparing for European opponents because their tactical discipline holds up differently under pressure than typical NBA-style teams. Many European rosters show dramatic shifts in shot selection and defensive rotation when losing - shifts that are invisible in season-average data.
Daniel Gutt's work in European basketball analytics has long relied on this type of contextual filtering. Breaking stats out by game result isn't a new idea in European scouting - but it remains underused at many levels, particularly in college and lower professional leagues.
For context on how European leagues differ tactically, the guide to European basketball vs NBA: key differences explained is a useful starting point before you start applying filters to cross-league scouting.
Building a Scouting Report Around Filtered Data
Once you've applied the scouting tip filter stats by game result, the next step is turning the numbers into an actionable report. Don't just present two columns of stats. Tell the story the data reveals.
A strong filtered scouting report answers these questions directly:
What does this opponent do in the first quarter of losing games that they don't do when winning?
Which players see usage increases when the team is under pressure?
Where does their defense give up the most ground when trailing?
Do their tendencies change more in home losses versus road losses?
When you frame the scouting tip filter stats by game result around specific situational questions, the report becomes a coaching tool - not just a data dump. Coaches can walk into film sessions with targeted clips and clear talking points instead of vague observations about "tendencies."
For guidance on structuring the actual document, the post on how to build a basketball player profile for scouts covers the formatting principles that make scouting reports readable and actionable.
Common Mistakes When Filtering Stats by Game Result
This method is powerful, but it's easy to misuse. Here are the errors that undermine the scouting tip filter stats by game result in practice.
Small sample sizes. If your opponent has only played 8 games, splitting them into wins and losses gives you 4 games per bucket. That's not enough to draw conclusions. Wait until you have at least 10 games in each bucket before trusting the filtered numbers.
Ignoring opponent quality. A team's losing stats against top-5 defenses don't necessarily predict how they'll play against you. Apply the scouting tip filter stats by game result with attention to opponent context, not just the raw outcome split.
Treating all losses equally. A team that lost by 30 plays very differently from a team that lost by 2. Consider filtering into sub-categories: blowout losses, close losses, and overtime losses each tell a different story.
Ignoring winning behavior. The scouting tip filter stats by game result isn't only about losing scenarios. Knowing what an opponent does when they're comfortable and leading helps you force them out of their comfort zone early in games.
One more mistake worth naming: over-indexing on a single outlier game. If a team gave up 40 three-point attempts in one loss, check whether that was a tactical choice or a blowout anomaly. The scouting tip filter stats by game result is only as reliable as the quality checks you apply to it. Strip out the obvious outliers before you draw any conclusions.
Putting the Scouting Tip Filter Stats by Game Result Into Your Workflow
The best time to start using this method is before your next opponent breakdown session. Pull the game log, split by result, and run through the key stat categories. You'll likely spot at least one pattern in the first session that changes something in your game plan.
Over time, the scouting tip filter stats by game result builds your library of opponent tendencies. You'll know which teams in your conference collapse under pressure, which ones get stronger, and which ones go completely off-script. That institutional knowledge compounds across a season.
Start small if you're new to this. Pick one stat category - say, three-point attempt rate - and apply the scouting tip filter stats by game result to that single metric before your next game. See what it tells you. Then expand to a second category the game after that. Building the habit gradually means you're more likely to actually use the data rather than getting buried in it.
If your current analytics setup doesn't support this kind of filtering, that's worth fixing. The difference between raw averages and filtered contextual data is the difference between knowing what a team does and knowing what they do when it counts. To see how Scouting4U handles this, you can request a demo directly at contact and demo requests.
Frequently Asked Questions
What does the scouting tip filter stats by game result actually mean in practice?
It means separating your opponent's statistical data into two groups: games they won and games they lost. You then analyze each group independently. The differences between the two groups reveal how that team changes its behavior under pressure - which is information you can't get from season averages alone.
How many games do I need before the filtered data is reliable?
You need at least 10 games in each bucket - wins and losses - before the patterns are meaningful. With fewer than that, one outlier game can skew the numbers significantly. If your opponent has a lopsided record, supplement with data from the previous season to fill out the thinner bucket.
Can the scouting tip filter stats by game result be applied to individual players, not just teams?
Yes, and it's often more revealing at the player level. Some players elevate their performance when their team is losing. Others disappear. Some take more shots, some fewer. Filtering individual player stats by game result shows you who responds to pressure and who doesn't - which directly affects how you guard them in critical moments.
What stats matter most when applying this filter?
Three-point attempt rate, paint touches, turnover rate, and defensive rotation breakdowns are the most diagnostic. These tend to shift the most dramatically between winning and losing game states. Pace is also worth tracking - some teams speed up when losing, others slow down, and each tendency suggests a different counter-strategy.
Does Scouting4U support the scouting tip filter stats by game result natively?
Yes. Scouting4U's platform lets you filter possession and play-type data by game result directly within the dashboard. You don't need to export to spreadsheets or do manual calculations. The filtered views include shot charts, rotation data, and play-type breakdowns - all segmented by whether the team was winning or losing. You can see the full list of filtering tools at Scouting4U platform features and tools.
Enjoyed this article? Share it with others!
Founder & Lead Scout, Scouting4U
2x EuroLeague champion with 30+ years in professional basketball. Daniel won EuroLeague titles with Maccabi Tel Aviv, helped build the staff behind the 2007 European Championship, and has delivered 100+ professional scouting reports across 50+ leagues. If it happened in a European basketball front office, he was probably in the room. He founded Scouting4U in 2010 to bring championship-level scouting intelligence to every club.
No reviews yet. Be the first to share your experience!
Related Articles

Mastering Basketball Service: Scouting Insights & Tools
Key TakeawaysA strong basketball service covers everything from player evaluation to game strategy analysis.Scouting4U g...

One Shot Chart. Three Insights Visual: Game Plan Revolution
Key TakeawaysA basketball shot chart three insights visual approach reveals high-efficiency zones, player tendencies, an...

How Do Coaches Prepare Scouting Reports?
Basketball Scouting Report Poll Coaches: How Coaches Actually PrepareEvery basketball scouting report poll coaches parti...