Mastering Basketball Analytics: PER and True Shooting
Basketball analytics has changed how teams, coaches, and fans understand the game. Advanced stats give us deeper insights into player performance and team dynamics. They go far beyond what the traditional box score can show. This guide will help you start Mastering Basketball Analytics by breaking down the most important tools: Player Efficiency Rating (PER), True Shooting Percentage (TS%), and other key advanced metrics. Whether you are a coach, a scout, or a passionate fan, mastering basketball analytics will sharpen your eye for the game in ways that traditional observation simply cannot match.
Let's break it all down in simple terms.
Understanding Player Efficiency Rating (PER)
What is PER?
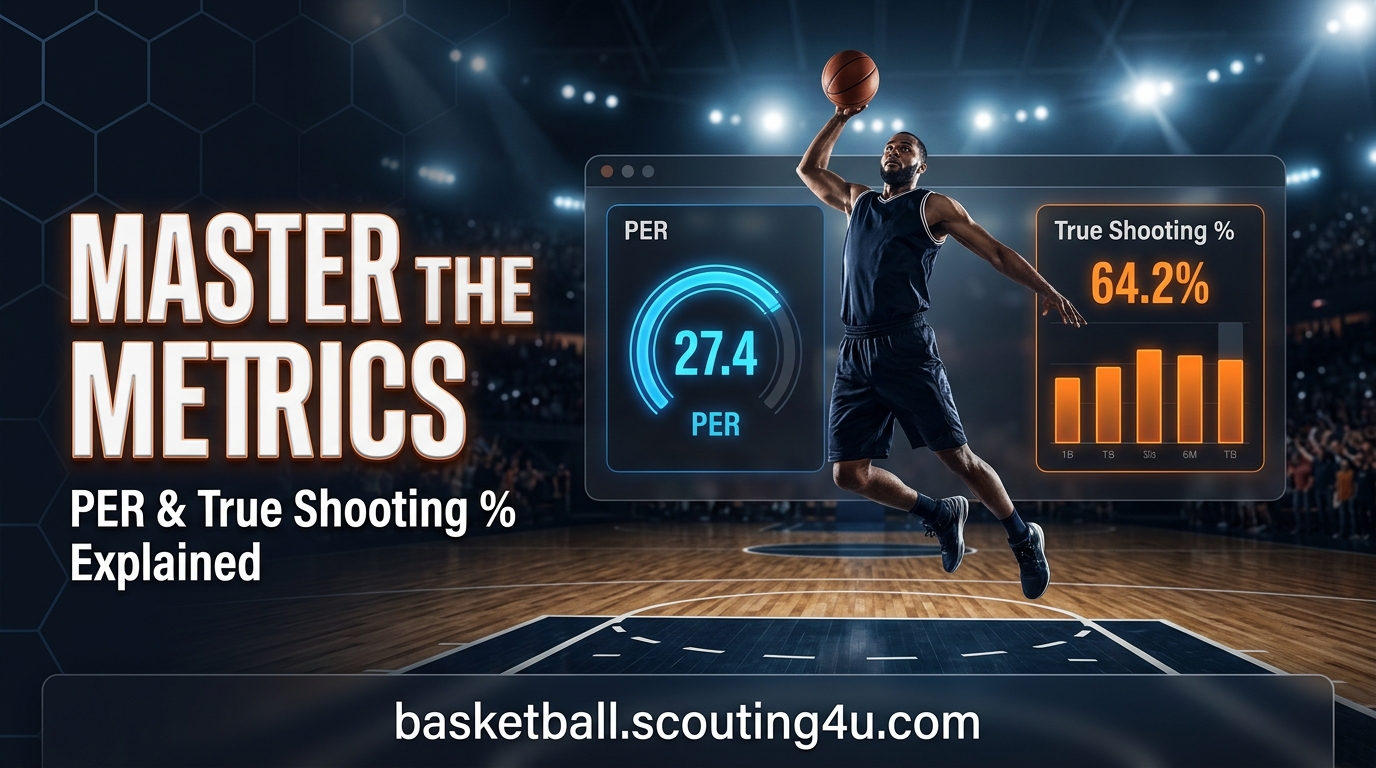
Player Efficiency Rating, or PER, was created by analyst John Hollinger. Its goal is simple: summarize a player's statistical output in one number. PER counts the good things a player does, like scoring, rebounding, and assisting. It also subtracts the bad things, like turnovers and missed shots. The result is a single score that reflects how efficient a player is on the court. For anyone serious about mastering basketball analytics, PER is one of the first metrics worth understanding deeply.
Think of PER as a report card for a player's statistical contributions. One number tells a quick story.
How is PER Calculated?
PER uses a detailed formula. It adjusts for the pace of play and normalizes the result across the entire league. A PER of 15 is considered average. The formula uses many variables, including field goals, free throws, three-point makes, assists, rebounds, steals, blocks, turnovers, and personal fouls.
The exact math is complex. But the key idea is straightforward. PER tries to capture everything a player does statistically and roll it into one clean number. Here is a simple breakdown of what goes in:
Positive inputs: Points, rebounds, assists, steals, blocks
Negative inputs: Turnovers, missed shots, personal fouls
Adjustments: Team pace, league averages
Elite players like LeBron James and Nikola Jokić regularly post PERs above 25. That is well above the league average of 15. Role players often sit between 10 and 14. When mastering basketball analytics, understanding where a player falls on the PER scale is a reliable starting benchmark.
Practical Insights from PER
PER is a useful starting point. But it has real limits. It leans heavily toward offensive statistics. Defensive skills that don't show up in the box score are often ignored. Things like on-ball defense, help rotations, and communication don't get counted.
So don't use PER alone. Combine it with other metrics and video review to get the full picture of what a player brings to a team. Mastering basketball analytics means knowing both what a metric reveals and what it conceals. PER is a starting point, not a final answer.
Exploring True Shooting Percentage (TS%)
Defining True Shooting Percentage
True Shooting Percentage, or TS%, measures shooting efficiency. It accounts for all three types of scoring: field goals, three-pointers, and free throws. This makes it more accurate than simple field goal percentage.
Why? Because a three-pointer is worth more than a two-pointer. And free throws are essentially "free" points. Regular field goal percentage ignores both of those facts. TS% does not.
If you want to understand how efficiently a player scores, TS% is one of the best tools available. Mastering basketball analytics requires a firm grip on TS%, as it is one of the most reliable measures of offensive value. For more on scoring efficiency, check out our detailed guide on Mastering Shot Selection: The Complete Guide to Scoring Efficiency in Basketball.
The Formula Behind TS%
The formula for TS% is:
TS% = Points / (2 × (Field Goal Attempts + 0.44 × Free Throw Attempts))
The factor of 0.44 adjusts for how many free throws typically come from a shooting foul. Most shooting fouls result in two free throws, but technical fouls and and-one plays change that average slightly. The 0.44 factor smooths all of that out.
A TS% above 57% is generally considered good. Above 60% is excellent. Star scorers like Kevin Durant and Stephen Curry have often posted TS% numbers above 62%. These benchmarks become second nature when you commit to mastering basketball analytics.
Using TS% in Player Evaluation
TS% is very useful when comparing players with different scoring styles. A three-point specialist and a post scorer may have very different field goal percentages. But their TS% might be similar if both are equally efficient in their own way.
Coaches and scouts use TS% to spot players who maximize every scoring opportunity. This makes it a vital tool for roster building and game planning. It helps answer a simple question: who makes the most out of the shots they take? Mastering basketball analytics means using TS% alongside other metrics to build the clearest possible picture of a player's offensive value.
Other Influential Advanced Stats
Win Shares (WS)
Win Shares estimates how many wins a player produces for their team. It looks at both offensive and defensive contributions. This gives a broader view of a player's impact than PER or TS% alone.
Win Shares per 48 minutes (WS/48) is a popular version of this stat. It adjusts for playing time. That makes it easier to compare starters with bench players. A player who dominates in 20 minutes per game can be fairly compared to a starter playing 35.
Win Shares are great for big-picture evaluations. They help answer: does this player actually help their team win? For anyone focused on mastering basketball analytics, Win Shares provide essential context that pure efficiency stats like PER and TS% cannot always offer on their own.
Box Plus/Minus (BPM)
Box Plus/Minus, or BPM, measures how much a player affects team performance per 100 possessions while they are on the court. It uses box score data and adjusts for team strength and opponent quality.
A BPM of 0 is average. A BPM of +5 means that team outscores opponents by 5 points per 100 possessions with that player on the floor. Elite players like Giannis Antetokounmpo and Joel Embiid often post BPMs above +7 in their best seasons.
BPM is useful for understanding how a player changes the game flow. It works best when used alongside other metrics. Mastering basketball analytics means learning to read BPM in combination with usage rate, defensive metrics, and context rather than as a standalone verdict.
Usage Rate
Usage Rate estimates what percentage of team plays a player is involved in while on the court. High usage players are usually the primary scorers or ball handlers. They touch the ball often and make decisions constantly.
Understanding usage rate helps put other stats in context. A player with a 35% usage rate who maintains a high TS% is extremely valuable. They handle a huge share of the offense without sacrificing efficiency. That is a rare combination that marks elite offensive players. Mastering basketball analytics involves appreciating how usage rate interacts with efficiency metrics to tell a richer story about a player's role and value.
Defensive Rating
Defensive Rating measures how many points a team allows per 100 possessions when a specific player is on the court. Lower numbers are better. This metric helps capture defensive value, which many other stats miss.
Good defenders bring their team's Defensive Rating down. Bad defenders allow it to rise. Pairing Defensive Rating with offensive metrics like PER and TS% gives a much more complete picture of a player's total value. Mastering basketball analytics on the defensive side of the ball is just as important as understanding offensive metrics, and Defensive Rating is your primary entry point.
Integrating Advanced Metrics in Scouting
For scouts and analysts, advanced metrics are essential. Traditional stats give a baseline. But metrics like PER and TS% reveal nuances that shape smarter decisions. These decisions include player trades, draft picks, free agent signings, and in-game adjustments. Mastering basketball analytics in a professional scouting context means learning to translate raw numbers into actionable recommendations.
Here is how to do it well:
Comprehensive Evaluation: Use PER, TS%, Win Shares, and BPM together. No single stat tells the whole story. Look for players who score well across multiple metrics. Mastering basketball analytics requires this multi-metric discipline above all else.
Contextual Analysis: Context matters. A high PER in a slow-paced system is different from the same PER in an up-tempo system. Always ask: under what conditions did the player produce these numbers?
Defensive Metrics: Offensive stats get all the attention. But defense wins championships. Use Defensive Rating and Defensive Win Shares to evaluate players on both ends of the floor.
Qualitative Insights: Numbers can't measure everything. Combine stats with video scouting to assess leadership, decision-making, coachability, and work ethic. These intangibles matter. Mastering basketball analytics means knowing when to trust the film over the spreadsheet.
Opponent Context: Who did the player produce these stats against? Strong performance against elite opponents is more valuable than padding stats against weak teams.
If you want to dive deeper into scouting technique, read our guide on How to Get Scouted in Basketball: The Player Development Guide Scouts Don't Tell You About. It covers what scouts actually look for, beyond the stat sheet.
For teams looking to build a complete analytical scouting system, our guide on The Complete Guide to Basketball Opponent Analysis Using Scouting4U shows how to combine video and data into one powerful workflow.
How Technology Supports Basketball Analytics
Modern tools have made mastering basketball analytics more accessible than ever. You no longer need an NBA front office budget to analyze players effectively. Platforms now exist that combine video, data, and scouting reports in one place.
These tools allow coaches and scouts to tag plays, track advanced stats, and build player profiles quickly. The best platforms make it easy to filter by metrics like TS%, Usage Rate, or BPM. They turn hours of manual work into minutes of smart analysis. Mastering basketball analytics in today's environment means taking full advantage of these technology-driven workflows.
If you are serious about using analytics in your scouting or coaching workflow, explore the tools available at Scouting4U subscription plans and pricing. The right platform can dramatically improve how you evaluate talent and prepare for opponents.
Common Mistakes When Using Advanced Metrics
Mastering basketball analytics also means recognizing the pitfalls. Analytics are powerful. But they are easy to misuse. Here are the most common mistakes to avoid:
Using one stat in isolation: No single metric tells the full story. Always combine multiple stats before drawing conclusions.
Ignoring sample size: Five games of data is not enough. Advanced stats become meaningful over a larger sample, usually 20+ games.
Forgetting context: A player's stats are shaped by their teammates, their role, and their opponent. Always consider the environment. This is a cornerstone habit for anyone mastering basketball analytics.
Dismissing the eye test: Stats and video work together. A player might have a great PER but show poor decision-making on film. Trust both sources of information.
Overcomplicating the analysis: More data does not always mean better decisions. Focus on the metrics most relevant to the specific question you are trying to answer. Mastering basketball analytics is about clarity, not complexity.
Conclusion
Mastering basketball analytics is a journey, not a destination. Metrics like PER and True Shooting Percentage are powerful tools. They help coaches, scouts, and analysts make smarter decisions. They reveal truths that traditional stats hide. The more deliberately you pursue mastering basketball analytics, the more these numbers will sharpen your understanding of the game at every level.
But these numbers work best when used together. Combine PER with TS%, Win Shares, BPM, and Defensive Rating. Add video review. Consider context. And always remember that basketball is played by human beings, not spreadsheets.
Start with the basics. Understand what each metric measures and what it misses. Build your analytical toolkit one layer at a time. Mastering basketball analytics is an ongoing process, and the more you practice reading these numbers, the more the game will reveal itself to you.
Frequently Asked Questions
What is Player Efficiency Rating (PER) in basketball?
PER is a single number that summarizes a player's statistical contributions per minute. It counts positive actions like points, rebounds, and assists, and subtracts negative ones like turnovers. A PER of 15 is league average. Higher is better. PER is one of the foundational metrics for anyone mastering basketball analytics.
What is a good True Shooting Percentage (TS%) in basketball?
A TS% above 57% is considered good. Above 60% is excellent. Elite scorers often reach 62% or higher. TS% accounts for two-point shots, three-point shots, and free throws, making it more accurate than simple field goal percentage. Understanding TS% benchmarks is a key step in mastering basketball analytics.
What does Win Shares mean in basketball analytics?
Win Shares estimates the number of wins a player contributes to their team. It considers both offense and defense. Win Shares per 48 minutes (WS/48) adjusts for playing time, making it easier to compare players with different roles. It is an essential component of mastering basketball analytics at a professional level.
What is Box Plus/Minus (BPM) in basketball?
BPM measures a player's impact on team performance per 100 possessions. A BPM of 0 is average. Positive numbers mean the team performs better with that player on the court. It uses box score data and adjusts for opponent quality.
How do scouts use advanced metrics in basketball?
Scouts combine metrics like PER, TS%, Win Shares, and Defensive Rating to build a complete picture of a player. They also use video scouting to evaluate things stats can't measure, like defense, leadership, and decision-making. Mastering basketball analytics in a scouting context means integrating both data and film into every evaluation.
What is Usage Rate in basketball?
Usage Rate estimates the percentage of team plays a player is involved in while on the court. A high usage rate means the player handles the ball often and takes on a large offensive role. Elite scorers often have usage rates above 30%.
What are the limits of basketball analytics?
Advanced metrics are powerful but imperfect. They can miss defensive contributions, teamwork, and intangible qualities like leadership. Small sample sizes can also produce misleading numbers. Mastering basketball analytics means always combining stats with video and context for the best results.
Enjoyed this article? Share it with others!
Founder & Lead Scout, Scouting4U
2x EuroLeague champion with 30+ years in professional basketball. Daniel won EuroLeague titles with Maccabi Tel Aviv, helped build the staff behind the 2007 European Championship, and has delivered 100+ professional scouting reports across 50+ leagues. If it happened in a European basketball front office, he was probably in the room. He founded Scouting4U in 2010 to bring championship-level scouting intelligence to every club.
No reviews yet. Be the first to share your experience!
Related Articles

Basketball Analysis: Elevate Game Insights with Video
Key TakeawaysSystematic video breakdown improves decision-making at every level of the game.Video tagging software makes...

Mastering Basketball Video Analysis for Coaches
Key TakeawaysBasketball video analysis helps coaches evaluate players and teams more accurately.Scouting4U offers advanc...

Mastering Basketball Service: Scouting Insights & Tools
Key TakeawaysA strong basketball service covers everything from player evaluation to game strategy analysis.Scouting4U g...